Today 07:00
11 June 2026
Safestore Holdings plc
("Safestore", "the Company" or "the Group")
Interim results for the half year ended 30 April 2026
Strong operational performance and a return to earnings growth as investment in expansion begins to deliver
| H1 2026 | H1 2025 | Change (Total) | Change (CER)2 |
FINANCIAL METRICS |
|
|
|
|
Total Revenue (£'m) | 120.6 | 112.8 | 6.9% | 5.6% |
LFL3 Revenue (£'m) | 117.3 | 111.9 | 5.0% | 3.5% |
Underlying EBITDAR4 (£'m) | 67.9 | 65.5 | 3.7% | 4.3% |
Operating Profit (£'m) | 53.3 | 112.9 | (52.8%) |
|
Underlying Profit before Tax5 (£'m) | 44.6 | 43.6 | 2.3% |
|
Statutory Profit before Tax (£'m) | 36.3 | 97.0 | (62.6%) |
|
Net cash inflows from operating activities6 (£'m) | 47.2 | 41.2 | 14.6% |
|
Adjusted Diluted EPRA EPS7 (pence) | 19.4p | 19.0p | 2.1% |
|
Interim Dividend per share (pence) | 10.2p | 10.1p | 1.0% |
|
Balance Sheet Metrics | H1 2026 | FY 2025 |
|
|
EPRA Basic NTA per Share (pence) | 1,120 | 1,129 | (0.8%) | |
Net Assets (£'m) | 2,273.6 | 2,288.4 | (0.6%) | |
Net debt (£'m) | 1,100.8 | 1,058.6 | 3.8% |
|
Loan to Value ratio ("LTV")8% | 29.1% | 28.1% | 1.0ppt |
|
OPERATING METRICS | H1 2026 | H1 2025 |
|
|
Maximum Lettable Area ("MLA")9 m sq ft | 9.5 | 9.1 | 4.4% |
|
Current Lettable Area ("CLA")10 m sq ft | 8.7 | 8.6 | 1.6% |
|
Closing Occupancy11 (% of CLA) | 75.1% | 74.4% | 0.7ppt |
|
LFL Closing Occupancy (% CLA) | 77.0% | 76.6% | 0.4ppt |
|
Group REVPAF12 (£ / sq ft) | 28.11 | 26.78 | 5.0% | 3.7% |
LFL REVPAF (£ / sq ft) | 29.08 | 27.36 | 6.3% | 5.1% |
Financial and operational progress
· | Group revenue at constant exchange rates (CER) up 5.6% to £120.6 million, with 3.5% LFL growth; positive LFL growth across all geographies and increasing contribution from non-LFL stores: |
o UK revenue +3.3% improved through the half year reaching £83.9 million, with increasing domestic occupancy, unit partitioning and higher average storage rates13 driving LFL growth of 2.4%; | |
o Paris revenue of €26.7 million, +4.6% includes LFL growth of 1.8% driven by an increase in rental rates with decreased LFL occupancy impacted by strong contribution from new stores. | |
o Expansion Markets14 total revenue of €15.4 million, +25.7%; strong growth in LFL (+16.8%) and non-LFL stores; Spain, Netherlands and Belgium all performed well; | |
o Underlying store EBITDAR increased by 5.6% to £78.9 million; inflationary cost pressures were partially offset by internal efficiencies, resulting in LFL cost of sales increase of 3.8% at CER, in line with expectations. | |
· | Underlying EBITDAR was £67.9 million, up 3.7%, reflecting higher administrative costs in the half. |
· | Operating profit down 52.8% to £53.3 million as a result of stable Investment Property values in H1 2026 versus a fair value gain in H1 2025 (gain of £49.5 million). |
· | Underlying net finance costs15 increased by £1.0 million to £14.0 million including the impact of increased borrowings to support the store expansion programme. Refinancing of October 2026-maturing USPPs secured. |
· | Underlying profit before tax of £44.6 million increased by 2.3% delivering Adjusted Diluted EPRA EPS of 19.4p, up 2.1% on prior year and representing a return to earnings growth. |
· | Statutory profit before tax of £36.3 million and Basic EPS of 15.3 pence declined 62.6% and 57.9% respectively reflecting the stable property values in the half versus a gain in the prior year. |
· | Interim dividend per share of 10.20p, up 1.0%, in line with progressive dividend policy reflecting earnings growth whilst rebuilding of dividend cover. |
· | Balance sheet remained strong with £2.3 billion of net assets. LTV ratio of 29.1% and interest cover ratio ("ICR")16 of 3.9x; capital structure underpinned by investment property valuation of £3.5 billion. |
· | Basic EPRA NTA per share of 1,120p, down 0.8% from FY 2025 due to currency exchange rates. |
Strategy on track, with pipeline delivery being executed as planned
· | Continued focus on REVPAF to optimise trading in our existing store portfolio where we see significant potential to drive further EBITDA growth from both LFL and non-LFL stores. |
· | Projected incremental EBITDA from development programme unchanged with openings in FY 2024 moving from non-LFL to stabilising LFL with their growth potential remaining. Non-LFL (stores opening from FY 2025) and pipeline projected to add £30-35 million EBITDA on stabilisation. |
· | Recently opened (non-LFL) stores on track to meet 10% yield-on-cost17 hurdle, with stabilised stores opened in 2016-2021 achieving between 10%-20%. |
· | £33.6 million investment in store development with MLA growing by 2% or 0.2 million sq ft to 9.5 million sq ft in the half year, with the addition of 4 new stores representing a planned reduction in pace of openings from the peak in FY 2025. |
Outlook and guidance
· | FY 2026 outlook: Return to earnings growth with projected EPS at the lower end of consensus18 range largely reflecting the expected impact of higher interest rates in H2 |
o Underlying LFL cost of sales growth now expected to be at lower end of 3%-6% range; | |
o Underlying net finance costs now projected to increase by £2-£3 million as a result of higher floating interest rates; | |
o Capital expenditure for full year on new stores of £86 million; | |
o 225k sq ft of additional MLA expected in H2 2026 with a further 733k sq ft MLA in FY 2027 and beyond. | |
· | On track to deliver £30-£35 million of incremental EBITDA from non-LFL stores and pipeline on stabilisation, in line with expectations. |
Frederic Vecchioli, Safestore's Chief Executive Officer, commented:
"Safestore delivered a positive performance in the first half of FY 2026, with like-for-like revenue growth across all our markets and a return to growth in underlying earnings. The interim dividend, an important part of the total return for our shareholders, is up 1% in line with our progressive dividend policy whilst rebuilding cover as our earnings grow.
Our new and recently opened stores are performing well and, together with the development pipeline of a further 17 stores, are expected to contribute an additional £30-35 million of EBITDA to the Group upon stabilisation over the coming years.
We continued to drive REVPAF and optimise trading across the like-for-like estate, which remains a key engine of profit growth for the Group, while the significant investment we have made in our expansion is now clearly translating into both revenue and earnings growth. As a result Safestore remains well positioned to deliver further growth in earnings and long-term value creation."
For further information, please contact:
Safestore Holdings PLC |
|
Frederic Vecchioli, Chief Executive Officer Simon Clinton, Chief Financial Officer | 020 8732 1500 |
| |
www.safestore.com |
|
|
|
FTI Consulting | |
Dido Laurimore | 020 3727 1000 |
Richard Gotla Oliver Parsons | safestore@fticonsulting.com |
Analyst and investor presentation
An analyst and investor webcast will be held at 9:30am BST today, 11 June 2026. Please contact FTI Consulting for further details
Notes to Editors
· Safestore is the UK's largest self-storage group with 215 stores on 30 April 2026 comprising:
o 140 in the UK (79 in London and the South East, 61 in key metropolitan areas including Manchester, Birmingham, Glasgow, Edinburgh, Liverpool, Sheffield, Leeds, Newcastle, and Bristol)
o 36 in the Paris region
o 17 in Spain
o 15 in the Netherlands
o 7 in Belgium.
o Joint ventures: 9 stores in Germany under a joint venture agreement with Carlyle and 12 stores in Italy under a joint venture agreement with Nuveen.
· As of 30 April 2026, Safestore had a maximum lettable area ("MLA") of 9.47 million sq ft (excluding the expansion pipeline stores) of which 6.55 million sq ft was occupied.
· Safestore was founded in the UK in 1998 and acquired "Une Pièce en Plus" ("UPP") in France in 2004 which was founded in 1998 by the current Safestore Group CEO Frederic Vecchioli.
· Safestore has been listed on the London Stock Exchange since 2007 and entered the FTSE 250 index in October 2015.
· The Group provides storage to around 107,000 personal and business customers and employs over 850 people across the Safestore Group.
Notes
We prepare our financial statements using IFRS but we also use adjusted measures in assessing and managing the performance of the business. These measures are not defined under IFRS and they may not be directly comparable with other companies' adjusted measures and are not intended to be a substitute for, or superior to, any IFRS measures of performance. These include like-for-like figures, to aid in the comparability of the underlying business as they exclude the impact on results of purchased, sold, opened or closed stores; and constant exchange rate ("CER") figures are provided to present results on a more comparable basis, removing FX movements. These metrics are disclosed because management review and monitor performance of the business on this basis. We also include a few measures defined by the European Public Real Estate Association ("EPRA"), which are designed to enhance transparency and comparability across the European Real Estate sector; see notes 11 and 13 below and 'Non-GAAP financial information' in the notes to the financial statements.
1 - Where reported amounts are presented either to the nearest £0.1 million or to the nearest 10,000 sq ft, the effect of rounding may impact the reported percentage change.
2 - CER is Constant Exchange Rate (Euro denominated results for the current period are retranslated at the exchange rate effective for the comparative period. Euro denominated results for the comparative period are translated at the exchange rates effective in that period, in order to present the reported results for the current period on a comparable basis).
3 - Like‐for‐like ("LFL") information includes only those stores which have been open throughout both the current and prior financial years, with adjustments made to remove the impact of new and closed stores, as well as corporate transactions.
4 - Underlying EBITDAR is defined as Operating Profit before exceptional items, share-based payments, corporate transaction costs, change in fair value of derivatives, gain/loss on investment properties, depreciation, the net profit from joint ventures and associates, interest and tax. It has been renamed to ensure the name more closely reflects the nature of the financial measure. Underlying Store EBITDAR is defined as Underlying EBITDAR before underlying administrative costs.
5 - Underlying profit before tax is defined as underlying EBITDAR less leasehold costs19, depreciation charged on property, plant and equipment, net profit from joint ventures and associates, and net finance charges relating to bank loans and cash.
6 - Cash flow before investing activities is defined as net cash inflow from operating activities less leasehold cost payments.
7 - Adjusted Diluted EPRA EPS is based on EPRA's definition of Earnings and is defined as profit or loss for the period after tax but excluding corporate transaction costs, change in fair value of derivatives, gain/loss on investment properties and the associated tax impacts. The Company then makes further adjustments for the impact of exceptional items, IFRS 2 share-based payment charges, exceptional tax items, and deferred tax charges. This adjusted earnings is divided by the diluted number of shares. The IFRS 2 cost is excluded as it is written back to distributable reserves and is a non-cash item (with the exception of the associated National Insurance element). Therefore, neither the Company's ability to distribute nor pay dividends are impacted (with the exception of the associated National Insurance element). The financial statements will disclose earnings on a statutory, EPRA and Adjusted Diluted EPRA basis and will provide a full reconciliation of the differences in the financial year in which any LTIP awards may vest.
8 - LTV ratio is loan to value ratio, which is defined as net debt (excluding lease liabilities) as a proportion of the valuation of investment properties and investment properties under construction (excluding lease liabilities).
9 - MLA is Maximum Lettable Area. Measured in square feet ("sq ft").
10 - CLA is Current Lettable Area excludes space not yet fitted out and space which is operationally unavailable from MLA (Maximum Lettable Area). Measured in square feet ("sq ft").
11 - Occupancy excludes offices but includes bulk tenancy.
12 - Revenue per Available Square Foot ("REVPAF") is an alternate performance measure used by the business and is considered by management as the best KPI of economic performance of a mature self-storage asset as it is the net outcome of the occupancy/rate mix plus ancillary sales. It is calculated by dividing revenue for the period by weighted average available square feet for the same period.
13 - Average storage rate is calculated as the revenue generated from self-storage divided by the average square footage occupied during the period in question.
14 - Expansion Markets comprise Spain, the Netherlands and Belgium plus income earned in relation to the associate in Germany and the joint venture in Italy.
15 - Net underlying finance costs represent the net finance expense before interest on obligations under lease liabilities, changes in fair value of derivatives and exceptional finance costs.
16 - ICR is interest cover ratio and is calculated as the ratio of underlying EBITDA after leasehold costs to underlying finance charges.
17 - Yield-on-cost is defined as incremental EBITDA divided by the initial investment in a new store.
18 - Company compiled consensus of analysts from May 2026: Adjusted Diluted EPRA EPS 42.4p with range 41.5p - 43.7p
19 - Leasehold costs reflect the rental expense and therefore include both the lease liability interest element and the fair value re-measurement of lease liabilities.
20 - EPRA's Best Practices Recommendations guidelines for Net Asset Value ("NAV") metrics are EPRA Net Tangible Assets ("NTA"), EPRA Net Reinstatement Value ("NRV") and EPRA Net Disposal Value ("NDV"). EPRA NTA is considered to be the most relevant measure for the Group's business which provides sustainable long term progressive returns and is now the primary measure of net The basis of calculation, including a reconciliation to reported net assets, is set out in note 15 to the financial statements. The basis of calculation, including a reconciliation to reported net assets, is set out in note 15 to the financial statements.
Reconciliations between underlying metrics and statutory metrics can be found in the financial review and financial statements sections of this announcement.
CEO REVIEW
Group Summary
Safestore delivered a positive performance in H1 2026, with LFL revenue growth across all markets and further delivery of our store expansion programme. These results reflect the two advantages that set Safestore apart: disciplined, low-cost investment and an operating model built to drive sector-leading REVPAF. Revenue growth and underlying store EBITDAR performance showed progress across all our geographies, notwithstanding the anticipated inflation-driven cost challenges and the profit drag impact of new store openings. Underlying profit before tax and adjusted diluted EPRA EPS both returned to growth despite higher net finance costs as a result of development capex which will contribute significantly to future earnings growth. Overall, the results for the period reflect good progress against our strategy to optimise the trading performance of the existing store portfolio including the benefit of growth from developments in recent years, whilst maintaining a strong balance sheet.
Financial summary
Group revenues grew 5.6% (CER) to £120.6 million, with LFL sales growth of 3.5% and newly opened (non-LFL) stores contributing £3.2 million of revenue, up from £0.9 million in the prior year. Underlying store EBITDAR was £77.8 million, up 4.1% (CER), a robust performance as we absorbed inflationary cost increases and the incremental costs of rolling out new stores. The underlying LFL cost of sales increase of 3.8% was mitigated by savings in store employee costs and utilities. Underlying LFL store EBITDAR margins remained strong at 66.6% (H1 2025: 66.7%).
Underlying central administrative costs increased by £1.7 million (CER) or 18.5% to £10.9 million due to investment in Group capabilities and the phasing of variable cost recognition in the prior year. This resulted in underlying EBITDAR of £67.9 million (CER), up 2.1%. Net underlying finance costs19 rose by £1.0 million to £14.0 million due to an increase in average borrowings to fund the store expansion programme and lower capitalised interest reflecting the planned development openings, partially offset by lower average interest rates in the first half of FY 2026. Overall underlying PBT increased by 2.3% to £44.6 million with Adjusted Diluted EPRA EPS growing by 2.1% to 19.4 pence.
Statutory profit before tax was £36.3 million (H1 2025: £97.0 million) reflecting a stable investment property valuation compared to a gain in the prior year. Basic EPS was 15.3 pence (H1 2025: 36.3 pence).
Cash flow before investing activities12 increased to £42.2 million (H1 2025: £36.1 million). We incurred total capex of £46.2 million, including £33.6 million on new store development compared to £58.0 million of new store development in H1 2025. FY 2025 represented the peak MLA opening year for the current development pipeline which runs to FY 2028 and beyond. Net debt excluding lease liabilities increased by £38.2 million since year-end to fund the store programme as planned. The average blended cost of debt decreased from year end FY 2025 by 0.12ppt to 3.34% due to lower base rates. Since the balance sheet date, we have taken steps to manage the upcoming USPP maturities in October 2026 with €150 million of new USPPs arranged with their draw timing matching the refinance dates.
Our balance sheet remains strong: interest cover was 3.9x (FY 2025: 4.0x) and LTV stood at 29.1% (FY 2025: 28.1%) with our capital structure underpinned by the stable valuation of our investment properties which was £3,283.6 million (FY 2025: £3,245.9 million) at 30 April 2026 This reflects the steady valuation of the LFL estate and growth from the value created by our new store development less the impact of currency movements.
Trading summary
Stores in our LFL portfolio (> two years old and 91% of MLA) delivered revenue growth of 3.5% year on year in the first half. LFL closing occupancy was 77.0%, up 0.4ppt, and LFL REVPAF at a Group level was up 5.1% to £28.74 (CER) reflecting our relentless focus on optimising trading in our existing store base.
Within the LFL estate, our mature stores (> five years old and 79% of MLA) delivered 2.1% revenue growth through improvements in average storage rate. Also within the LFL estate, our stabilising stores (sites two-five years old and 12% of MLA), delivered good occupancy and REVPAF growth, contributing 1.6ppt of the total 3.5% LFL revenue growth. Their performance underlines the opportunity to drive highly profitable growth as they trade towards more mature occupancy levels.
Non-LFL stores (< two years old and 9% of MLA) delivered strong revenue growth, contributing an additional £2.3 million of sales to the Group (CER) as they quickly grow their occupancy and build REVPAF.
In the UK our performance was driven by robust domestic customer demand and the continued conversion of space to smaller units that command higher rates. The UK business produced encouraging LFL revenue growth of +2.4% and largely offset inflationary cost pressures to achieve a broadly stable underlying LFL store EBITDAR margin for the half year. In Paris, notwithstanding the already flagged and expected cannibalisation following the 20% increase in our store numbers, the business still produced robust revenue and 1.1% underlying LFL store EBITDAR growth. Our stores in Expansion Markets (Spain, the Netherlands and Belgium) delivered a strong trading performance and also a significant increase in underlying store EBITDAR with revenue growth in newer stores.
Portfolio and pipeline
We continued to deliver successfully on our new space programme with four new stores - in Paris (2), London and Madrid - opened in the first half of the year adding 192,000 sq ft of MLA. New stores are trading in line with our expectations and are on track to meet our hurdle yield-on-cost return rate of 10%, the highest in the industry. Looking ahead, we are on track to deliver an additional 224,600 sq ft in the second half of FY 2026, which will give a total 4.5% uplift to Group MLA for the year, in line with our planned reduction in pace of openings from the peak in FY 2025. The remaining pipeline of new space to be delivered in subsequent years is expected to add 1.0 million sq ft with one site added to the pipeline since the FY 2025 results.
Platform and technology highlights
We made good progress in building our digital scale and the value of our proprietary 28-year data set of over two million lets, further strengthening our competitive advantage. In FY 2025 we accelerated the integration of advanced AI across marketing, pricing and property development capabilities that smaller operators cannot replicate and continued to build on that in the first half. Major initiatives in marketing - including refining expenditure allocation through a proprietary AI-driven Customer Value Model that optimises pay-per-click spend, the use of Google reviews sentiment tracking and SEO search visibility partnerships - helped to maintain our overall marketing spend at a broadly flat percentage of revenue year on year, whilst enhancing enquiry capture. In pricing architecture, we developed our predictive modelling which anticipates occupancy trends and churn risks. This enables more proactive revenue management, for example through targeted discounting for low conversion segments. The operational productivity of our sales teams continued to improve with the use of enquiry conversion scoring models and automated sales calls transcript analysis to drive performance coaching and ultimately revenue generation. In Europe, we believe that very few operators have a structured historical data set of comparable depth available to perform the kind of analyses and AI activity we undertake. This represents a distinctive and durable advantage.
Our priorities in FY 2026
We continue to grow REVPAF across all our stores, to deliver further cost efficiencies that mitigate inflationary cost growth, and to deliver the pipeline of new stores on time and on budget, whilst maintaining our disciplined approach to investment. Together, we expect these ongoing, core elements of our strategy to generate long term, sustainable growth in earnings.
Dividend
The Board is pleased to increase the interim dividend by 1% to 10.20 pence in line with our progressive dividend policy whilst rebuilding dividend cover over the medium term.
Outlook
We are confident about the remainder of the year, in which we expect earnings per share growth to continue. With fewer store openings than in FY 2025, we also anticipate reducing earnings drag from new stores this year and beyond, as recent openings mature and contribute to earnings.
In FY 2026 we expect:
· LFL cost of sales growth at lower end of 3%-6% range;
· Underlying net finance costs increasing £2-£3 million - an increase from previous guidance due to elevated floating interest rates;
· Year-on-year MLA growth of 4.5% (0.4 million sq ft) in FY 2026 with a further 7.6% MLA in FY 2027 and beyond; and
· Capital expenditure on new stores of £86 million.
Looking ahead, the Board is confident that the market dynamics for self-storage in the UK and Europe remain positive with our unique portfolio well positioned to deliver growth. We will continue to leverage and finesse our marketing and operational expertise to drive REVPAF and earnings. Growth will be driven by:
· EBITDA growth from LFL stores:
o Mature LFL stores (>five years old), which represent 79% of MLA, through rate improvements, benefits from UK partitioning, and cost inflation easing.
o Contribution from fully invested stabilising LFL stores (between two and five years old), which currently represent 12% of MLA, as they continue up the maturity curve, increase occupancy and build profitability.
· Increasing contribution from our non-LFL stores (< two years old) which represent 9% of MLA) and our current pipeline of 1.0 million sq ft projected to open over the next few years. This 1.8 million sq ft of space will contribute increasingly to earnings as stores fill occupancy and cover their fixed costs. These stores are expected to generate an incremental £30-£35 million of EBITDA upon stabilisation (a reduction from FY 2025 projections as stores opened in FY 2024 now reclassified into LFL).
· Our joint ventures in Germany and Italy present an opportunity to expand from a small footprint of stores with a lower initial capital outlay and management fee income. We see the potential for other opportunities with this model to drive longer term portfolio growth.
Trading and Operational Review
Trading Data | TOTAL | LIKE-FOR-LIKE | ||||
REVENUE METRICS | H1 2026 | H1 2025 | Change | H1 2026 | H1 2025 | Change |
Revenue |
|
|
|
|
|
|
Group (GBP) | £120.6m | £112.8m | 6.9% | £115.9m | £111.9m | 3.5% |
UK (GBP) | £83.9m | £81.2m | 3.3% | £82.7m | £80.8m | 2.4% |
Paris (EUR) | €26.7m | €25.5m | 4.6% | €26.0m | €25.5m | 1.8% |
Expansion Markets (EUR) | €15.4m | €12.2m | 25.7% | €13.7m | €11.7m | 16.8% |
Average Rate (per sq ft) |
|
|
|
|
|
|
Group (GBP) | £31.38 | £29.98 | 4.7% | £31.51 | £30.05 | 4.9% |
UK (GBP) | £32.26 | £30.36 | 6.3% | £32.36 | £30.39 | 6.5% |
Paris (EUR) | €41.75 | €42.24 | (1.2%) | €43.26 | €42.31 | 2.3% |
Expansion Markets (EUR) | €24.71 | €24.43 | 1.1% | €25.57 | €24.56 | 4.1% |
REVPAF (per sq ft) |
|
|
|
|
|
|
Group (GBP) | £28.11 | £26.78 | 5.0% | £28.74 | £27.36 | 5.1% |
UK (GBP) | £29.66 | £28.44 | 4.3% | £29.84 | £28.60 | 4.3% |
Paris (EUR) | €35.11 | €37.16 | (5.5%) | €38.24 | €37.91 | 0.9% |
Expansion Markets (EUR) | €21.97 | €18.25 | 20.4% | €23.51 | €19.72 | 19.2% |
| ||||||
SPACE AND OCCUPANCY METRICS | H1 2026 | H1 2025 | Change | H1 2026 | H1 2025 | Change |
Closing Occupancy (million sq ft) |
|
|
| |||
Group | 6.55 | 6.38 | 2.6% | 6.27 | 6.32 | (0.8%) |
UK | 4.37 | 4.44 | (1.4%) | 4.31 | 4.41 | (2.4%) |
Paris | 1.16 | 1.12 | 3.4% | 1.07 | 1.11 | (3.4%) |
Expansion Markets | 1.02 | 0.82 | 23.2% | 0.89 | 0.80 | 11.8% |
Closing Occupancy (% of CLA) |
|
|
| |||
Group | 75.1% | 74.4% | 0.7ppt | 77.0% | 76.6% | 0.4ppt |
UK | 76.7% | 77.0% | (0.3ppt) | 77.1% | 77.6% | (0.5ppt) |
Paris | 74.0% | 79.2% | (5.2ppt) | 78.7% | 81.8% | (3.1ppt) |
Expansion Markets | 69.9% | 58.6% | 11.3ppt | 74.6% | 66.0% | 8.5ppt |
CLA (million sq ft) |
| |||||
Group | 8.72 | 8.58 | 1.6% | 8.14 | 8.25 | (1.3%) |
UK | 5.70 | 5.76 | (1.1%) | 5.59 | 5.68 | (1.8%) |
Paris | 1.57 | 1.41 | 10.7% | 1.36 | 1.36 | 0.5% |
Expansion Markets | 1.45 | 1.41 | 3.4% | 1.19 | 1.21 | (1.0%) |
In the above table, Total Group figures are converted at Actual exchange rates, LFL Group figures are converted at CER
Geographic underlying performance - P&L in Local Currencies
| H1 2026 | H1 2025 | ||||||
Underlying performance (CER) | UK | Paris | Exp Mkt | Total (CER) | UK | Paris | Exp Mkt | Total (CER) |
| £'m | €m | €m | £'m | £'m | €m | €m | £'m |
|
|
|
|
|
|
| ||
LFL | 82.7 | 26.0 | 13.7 | 115.9 | 80.8 | 25.5 | 11.7 | 111.9 |
Non-LFL | 1.2 | 0.7 | 1.7 | 3.2 | 0.4 | - | 0.5 | 0.9 |
Total Revenue | 83.9 | 26.7 | 15.4 | 119.1 | 81.2 | 25.5 | 12.2 | 112.8 |
|
|
|
|
|
|
| ||
LFL Store EBITDAR | 54.1 | 19.1 | 8.4 | 77.2 | 53.3 | 18.8 | 6.8 | 74.6 |
Non-LFL Store EBITDAR | 0.4 | (0.4) | 0.6 | 0.6 | 0.1 | - | - | 0.1 |
Total Store EBITDAR | 54.5 | 18.7 | 9.0 | 77.8 | 53.4 | 18.8 | 6.8 | 74.7 |
LFL Store EBITDAR margin | 65.4% | 73.5% | 61.3% | 66.6% | 66.0% | 73.7% | 58.1% | 66.7% |
UK (64% of MLA, 140 stores)
Our operational performance in the UK reflects a continuation of the growth seen in FY 2025. Total revenue was up 3.3% to £83.9 million with LFL growth of 2.4% to £82.7 million.
Driven by increased product adoption, demand from domestic customers remained robust throughout the year, with LFL space occupied broadly flat year on year (down 0.1%), with our continued partitioning programme converting larger units into smaller units which are better suited to domestic customer demand.
The programme is reducing our historical overweight to larger units (>250 sq ft) within our UK portfolio, resulting in smaller and higher yielding configurations and enabling a more typical 70/30 domestic/business customer split in terms of space occupied. We intend to convert a total of 500,000 sq ft (out of an initial total of approximately 1 million sq ft) of larger units into smaller units over two years and maintained our good progress in the period with a further 80,000 sq ft completed taking the total to 280,000 sq ft. As smaller units have a higher rental value/sq ft, this has a positive impact on the average rate we achieve and ultimately will drive REVPAF growth.
LFL occupancy closed broadly flat year on year at 77.1% with occupied space in units smaller than 250 sq ft increasing 0.6% and occupied space in larger units decreasing by 127,000 sq ft (16.4%). Business customer LFL occupied space is down 5.9% on FY 2025, with the level impacted by the unit partitioning programme described above. This change in mix to smaller units and domestic customers contributed to the increase of 6.5% in the achieved rate for LFL stores, reflecting the Group's strategy to optimise REVPAF.
In the period there were ten UK stores still stabilising and included in LFL. These stores, which are between two and five years old, saw improved occupancy and provided a meaningful contribution to LFL revenue growth. We expect stabilised occupancy of 85%-90% in our UK LFL portfolio, compared to the 77.1% achieved at the close of H1 2026, with further occupancy growth in stabilising stores expected to be a contributing driver in closing this gap.
In addition to our LFL portfolio we have three stores opened since the end of FY 2024 which are currently classified as non-LFL. These stores contributed £0.8 million to year-on-year revenue growth in the half year and are performing in line with their expected maturity curve.
The UK underlying LFL store EBITDAR margin was stable year on year at 65.4% (H1 2025: 66.0%). This was due to an increase in the LFL cost of sales base of 4.0% driven largely by inflation-linked increases in business rates and marketing costs partially offset by savings from integrating call centre activities in stores and improved insurance costs. As a result, UK underlying LFL store EBITDAR increased by £0.8 million to £54.1 million for the financial year.
The strong growth in revenue from non-LFL stores in the UK led to store EBITDAR for the UK to increase £1.1m, or 2.1%, year-on-year.
The mix of our customer base is depicted in the table below. The combined impacts of stronger demand from domestic customers and the partitioning of larger units, resulted in the proportion of domestic customers in the UK increasing to 63% of occupied sq ft at the end of H1 2026 (H1 2025: 62%).
|
|
|
|
|
|
| Business and Domestic Customers H1 2026 | UK | Paris | Exp Mkt |
|
| Domestic Customers |
|
|
|
|
| Numbers (% of total) | 79% | 83% | 90% |
|
| Square feet occupied (% of total) | 63% | 67% | 84% |
|
| Average Length of Stay (months) | 17.7 | 22.1 | 21.2 |
|
|
|
|
|
|
|
| Business Customers |
|
|
|
|
| Numbers (% of total) | 21% | 17% | 10% |
|
| Square feet occupied (% of total) | 37% | 33% | 16% |
|
| Average Length of Stay (months) | 26.0 | 26.3 | 31.7 |
|
|
|
|
|
|
|
Paris (19% of MLA, 36 stores)
Our Paris business delivered revenue of €26.7 million, a 4.6% increase year on year. LFL stores grew 1.8% and non-LFL delivered an additional €0.7 million of revenue. This result in the context of the continued weaker economic conditions in the region demonstrates the ongoing resilience of the business.
On a LFL basis, occupancy declined versus prior year over the period to close at 78.7% at the end of April, down 3.1% reflecting the previously flagged and expected cannibalisation from a concentrated phase of expansion. The LFL average rate achieved was up 2.3% and as a result LFL REVPAF increased slightly (+0.9%) as we focused on optimising income.
Since the start of FY 2024, we have opened six new stores and one extension in Paris, with a further two in the pipeline which will take the number of stores in the market to 38. Non-LFL stores contributed €0.7 million to year-on-year revenue growth in the half. With the new space added to date, our portfolio density within central Paris has increased substantially and, whilst we expect that the new stores will be significant contributors to growth as they mature in the years ahead, we believe that performance of LFL stores has been impacted in the half year due to our approach of giving customers choice of storage locations and prices with cross-network space allocation.
The underlying LFL store EBITDAR margin was stable year on year at 73.5% with LFL cost of sales in Paris increasing 3.0% year on year. This reflected a slightly elevated bad debt provision and increases in business rates partially offset by continued tight cost control, particularly in the dynamic management of staffing.
As a result, underlying LFL store EBITDAR for Paris increased 1.6% year on year to €19.1 million for the half. Total underlying store EBITDAR was broadly flat on last year (-0.5%) reflecting an initial profit drag from new store openings.
Expansion Markets (17% MLA, 39 stores)
Our Expansion Markets continued to be a strong contributor to Group growth with LFL revenue increasing 16.8% year on year to €13.7 million and total revenue increasing 25.7% to €15.4 million for the half year.
Performance in each market was strong. In Spain (17 stores in total) revenue grew 21.2% on a LFL basis to €4.7m, through both occupancy and rate improvements with growth supported by eight stabilising stores. LFL revenue in the Netherlands (15 stores) of €5.4m and Belgium (7 stores) of €2.8m grew by 14.0% through both occupancy and rate increases and 5.2% due to rate increases respectively.
LFL closing occupancy increased from 66.0% to 74.6%, with the growth in particular coming from stabilising stores in the Netherlands and Spain as they fill up towards the Mature LFL store average level of 80.4% (H1 2025: 81.6%).
New stores and expansions contributed €1.7 million of non-LFL revenue, with growth of €1.2 million in the half year, largely through openings in Spain.
Management fees from our joint ventures in Germany and Italy contributed €1.4 million to Expansion Market revenue (H1 2025: €0.8 million).
The underlying LFL store EBITDAR margin increased to 61.3%, up 3.2ppts. LFL costs of sales for Expansion Markets increased 8.2%, reflecting a mix of normal inflationary increases and the timing of maintenance expenses. As a result, Expansion Markets underlying LFL store EBITDAR increased 23.5% with underlying store EBITDAR for the period including non-LFL stores increasing 32.4% year-on-year.
Joint Ventures and Associates
We have an associate investment with Carlyle in Germany and a joint venture with Nuveen in Italy. These joint ventures represent a route for the Group to access new geographies and expand our managed portfolio with diluted risk and with lower capital deployed. We earn management fees which are recorded in Expansion Market revenue together with our share of the results of the joint ventures themselves.
Our associate in Germany has nine stores totalling 455,000 sq ft including two new stores in H1 2026, with a further three under development. Safestore owns 10% of the associate. The underlying share of losses for H1 2026, a €0.1 million loss (H1 2025: €0.2 million loss), includes the impact on store EBITDA from new store openings in the joint venture.
We entered into the joint venture in Italy in December 2024 through the acquisition of a 50% share in EasyBox at a cost of £38.9 million. EasyBox comprises 12 stores (of which two opened in FY 2025) and is a leading platform in the emerging Italian storage market where the supply of self-storage is equivalent to 3% of that in the UK. The stores are located in the key economic centres of Rome and northern Italy and total 821,675 sq ft and are performing in line with our expectations. The underlying share of profit for H1 2026, a €0.1 million gain (H1 2025: €0.2 million gain) reflects the profit for the six months to March 2026. This includes the impact on earnings of the two new stores which are progressing in line with plan but have not yet reached break-even.
MLA and CLA space and occupancy by geography
When developing new stores, we occasionally delay the full fit out of the interior of our stores to reflect the phasing of occupancy increases. In addition, through the partitioning programme, space can be held as unavailable until it is converted. Together these areas which are still to be fitted out are not available to be leased and are hence excluded from CLA.
| |||||||||
MLA (m sq ft) | To be fitted out (m sq ft) | Operationally unavailable (m sq ft) | CLA (m sq ft) | % Occupancy of MLA | % Occupancy of CLA |
| |||
| |||||||||
UK | 6.0 | (0.1) | (0.2) | 5.7 | 72.5% | 76.7% |
| ||
Paris | 1.8 | (0.2) | (0.0) | 1.6 | 65.0% | 74.0% |
| ||
Exp Mkt | 1.7 | (0.2) | (0.1) | 1.4 | 61.5% | 69.9% |
| ||
Total | 9.5 | (0.5) | (0.3) | 8.7 | 69.1% | 75.1% |
| ||
Pan-European platform for growth
Safestore's development strategy reflects the reality that, increasingly shaped by modern technology and scale-enabled expertise, our stores are best managed at a European level. Our core strategic functions - Marketing, IT, Revenue Management, Pricing, Data and analytics, AI, Finance and Construction Analytics, and Sales Learning and Development - are run from our UK headquarters, serving all 236 stores under management. We retain legacy head offices in France and Spain, where local expertise enhances asset performance, while Belgium, the Netherlands, Germany and Italy run without one.
In self-storage, the investment is made almost entirely upfront, for assets that must perform across decades and unpredictable economic cycles. Safestore has never varied its double-digit yield-on-cost target and has maintained its discipline throughout, including through historically low interest rates. Our strategy combines this discipline with high REVPAF.
Development sites that meet our stringent criteria are rare, arising unpredictably across Europe's principal markets. Safestore has therefore built a presence across several markets, letting us stay highly selective on any single opportunity while keeping a sizable pipeline. There is always an attractive opportunity somewhere, and our geographical reach gives us access to it over time. This contrasts with strategies confined to a single geography and timeframe, which rarely achieve the lowest entry cost, forcing operators to trade at high local rates to meet value-add return thresholds.
A unique combination
Safestore's position combines two reinforcing advantages. On day one, our capital discipline lets us invest at a lower cost: we are under no pressure to deploy a defined amount of capital in a defined period or geography, and our reach gives us access to the right opportunities as they arise.
We then achieve a higher REVPAF through operational strengths that are hard to replicate: technology combined with sales expertise and 28 years of operating experience, the scale of our digital operations, proprietary data that new entrants cannot acquire, and the learnings of running every type of store, location and asset, from fully automated to staffed.
We let customers decide how they wish to interact with us: a unit can be chosen, contracted, paid for and ID-verified entirely online, then accessed via a code, unassisted. Nevertheless, our data consistently shows staffed interactions drive superior financial outcomes, including higher conversion and rental yields. In the UK, spontaneous adoption of the fully automated journey by our online customers has held stable at approximately 15%, and while 60% of our customers contract remotely, most, particularly first-time users, prefer our teams beforehand. Consultative selling helps them choose the right unit size and goods protection, supporting yield. The result is an industry-leading ancillary sales contribution (15% of total revenue in H1 2026) and REVPAF among the sector's highest, up 5.1% like-for-like - delivering value well in excess of our store teams' cost.
Our digital platform is a critical differentiator for new lease enquiry generation and revenue optimisation. Our centralised, in-house specialists, together with our proprietary dataset of many years of leasing history, develop advanced marketing tools and machine-learning algorithms to drive performance. This gives us a distinct advantage over a market of smaller operators lacking the data depth to replicate our price and occupancy optimisation.
We continue to accelerate the utilisation of Artificial Intelligence across our key functions to drive efficiency, optimise revenue and enhance investment rigour. In marketing, a proprietary AI-driven Customer Value Model refines expenditure by feeding enquiry value data back to Google to optimise pay-per-click spend, while generative AI scales multi-lingual content. We also strengthened our digital presence through Google reviews tracking, SEO search visibility partnerships and AI-led campaign tools on emerging platforms. In H1 2026 this held marketing cost broadly stable at 4.2% of revenue (H1 2025: 4.2%).
We also improved our pricing architecture through predictive modelling that anticipates occupancy trends and churn risks, enabling proactive revenue management, including targeted discounting for low-conversion segments and elasticity modelling to optimise rate changes. Sales-team productivity improved through enquiry conversion scoring and automated analysis of sales-call transcripts for coaching, while custom AI agents will streamline internal queries and credit control authorisations. Demand and rate prediction models now validate new site selection, mitigating risk in untested markets and ensuring robust capital deployment.
Portfolio Review
Development programme progress
In recent years we have stepped up our organic development programme to take advantage of new space opportunities and ensure longer term earnings growth for the portfolio. Since FY 2023 we have delivered 34 new stores totalling 1.6 million sq ft of new space with investment of £258 million in new store capital expenditure, expanding the Group's MLA by 21.0% to 9.5m sq ft.
As part of this programme, in H1 2026 we opened four new stores, adding 0.2 million sq ft to the portfolio and reaching 215 stores. The openings in the period comprise two in Paris and one each in London and Madrid demonstrating the focus on key metropolitan areas in each country.
With these openings, we now have 39 stores in Expansion Markets reflecting our investment in countries where there are relatively low levels of supply and positioning our portfolio to capture the opportunity as these markets grow with revenue from the segment now reaching 11% of Group total.
H1 2026 Stores Opened | FH/LH | MLA('000 sq ft) | Development Type |
London - Wembley | FH | 55.3 | New Build |
Paris - Colombes | FH | 65.2 | Conversion |
Paris - West 4 (Orgeval) | FH | 53.0 | New Build |
Madrid - Perseo | FH | 18.5 | Conversion |
Total openings in H1 2026 | 192.0 |
Our portfolio at the end of H1 2026 is shown in the table below.
Store Portfolio | Number of stores | MLA (m sq ft) | % of Group MLA | H1 2026 % increase in MLA (sq ft) |
London & South East England | 79 | 3.24 | 34% | 1.7% |
Rest of UK | 61 | 2.80 | 30% | 0.0% |
UK Total | 140 | 6.04 | 64% | 0.9% |
Paris | 36 | 1.78 | 19% | 7.4% |
Expansion Markets | 39 | 1.65 | 17% | 0.7% |
Total Group | 215 | 9.47 | 100% | 2.0% |
JVs (Italy & Germany) | 21 | 1.28 | 11.0% | |
Total group managed MLA (inc JVs) | 236 | 10.75 | 3.0% | |
|
|
|
|
The valuation of our portfolio of investment properties was broadly flat since the FY 2025 year end primarily driven by development capex and revaluation of completed stores, with a valuation at 30 April 2026 of £3.5 billion. We continue to finance our development programme through a combination of retained cash flow and debt and as a result Net Debt increased in the half year by £42.2 million to £1,100.8 million, with the balance sheet remaining strong and comfortably within our covenants. This disciplined approach to capital allocation has allowed us to add 2.5 million sq ft to the portfolio over the last ten years without the need for any equity increases.
Development pipeline
There is a further 1.0 million sq ft of space (17 stores) in the current development pipeline to be delivered with total associated capex of £192 million (of which £103 million remained at 30 April 2026). Within this is one new site that has been identified and secured since the FY 2025 year end results. The pipeline continues to reflect our focus on key metropolitan areas across our markets and includes ten stores in London and SE England, two stores in Paris and one in Barcelona. In FY 2026 to date, four stores have been opened with two in Paris and one in each of Madrid and London.
Our pipeline prioritises acquiring sites subject to planning, ensuring that capital for land or building acquisition is deployed only when construction is imminent, which significantly shortens the investment cycle and accelerates payback timing. The pipeline reflects an average facility size of 55,000 sq ft and avoids the development of oversized stores, which we believe offer materially lower returns on capital due to lower rental rates (a stabilised rate c. 20% less than our portfolio average), higher construction costs and longer permitting timelines.
On completion of the existing pipeline the total investment since the start of FY 2023 will be £453 million funding 2.6 million sq ft of space and 51 new stores. In addition, we have invested a total of £51.2 million in joint ventures in Germany and Italy, which are generating management fees and provide us with the opportunity to access at scale two large European markets.
Our development hurdle rate is 10% yield-on-cost (defined as incremental EBITDA/initial investment) upon stabilisation, which is usually five to six years from opening with earnings break-even (after the cost of financing) achieved between 18 and 24 months. Consistent with our investment model, new stores typically follow a clear 'J-curve' trajectory: while year 1 reflects the impact of a fixed cost base whilst sales ramp up, stores typically achieve operational break-even towards the end of the first year, followed by rapid yield acceleration in years 2 to 5 as occupancy and rate move towards stabilisation.
Recent vintages of new stores, including those opened in FY 2022 and FY 2023, are tracking in line with these established historical benchmarks towards our hurdle rate, underpinning our confidence in the future revenue contribution from our development pipeline. We expect our non-LFL stores (stores
Beyond the existing pipeline, our strong cash flow and disciplined approach to capital allocation means that we have financial capacity for further moderate space expansion. We will take advantage of selective opportunities accordingly, including investment in joint ventures, while being mindful of the short-term impact on earnings from new store costs and finance expenses.
New stores and extensions opening programme
We have a total pipeline of 17 developments opening in H2 2026 and beyond, which is expected to add a total of 1.0 million sq ft, representing 10.1% of the portfolio MLA as at 30 April 2026. All sites in our development pipeline are new freehold sites.
In addition to the 192,000 sq ft of MLA added in H1 2026, there is a pipeline of four stores with 224,600 sq ft of MLA projected to be opening during the remainder of FY 2026. This brings a total additional MLA projected to be delivered in FY 2026 to 416,600 sq ft. Of the eight stores to open in FY 2026, five will be in the UK, two in Paris and one in Spain.
Remaining FY 2026 openings | FH/LH | MLA('000 sq ft) | Development type | Status* |
London - Woodford | FH | 68.7 | New Build | C, UC |
London - Watford | FH | 57.5 | New Build | C, UC |
Hemel Hempstead | FH | 51.3 | New Build | C, UC |
Shoreham | FH | 47.1 | New Build | C, UC |
Total remaining openings in FY 2026 | 224.6 |
Our ongoing pipeline of new store developments beyond FY 2026 comprises 13 projects identified which will deliver an additional 733,300 sq ft of new space. Of the 13 developments ten will be in the UK, two in Paris and one in Spain.
FY 2027 | FH/LH | MLA('000 sq ft) | Development type | Status* |
Nottingham - Abbeyfield Road | FH | 55.0 | Conversion | C, PG |
Welwyn Garden City | FH | 51.0 | New Build | CE, PG |
Norwich | FH | 52.7 | New Build | C, PG |
Swindon | FH | 52.0 | New Build | C, PG |
Paris - Bry-sur-Marne | FH | 58.1 | New Build | C, UC |
Paris - West 1 (Conflans) | FH | 56.0 | New Build | C, UC |
Total FY 2027
| 324.8 |
FY 2028 and beyond openings | FH/LH | MLA('000 sq ft) | Development type | Status* |
London - Old Kent Road | FH | 75.6 | New Build | C, STP |
London - Belvedere | FH | 53.6 | New Build | C, PG |
London - Bermondsey | FH | 50.0 | New Build | C, STP |
London - Kingston | FH | 55.0 | New Build | C, PG |
Birmingham Erdington | FH | 55.0 | New Build | CE, PG |
Woking | FH | 55.0 | New Build | CE, STP |
Barcelona - Hospitalet | FH | 64.3 | New Build | CE, STP |
Total FY 2028 and beyond openings | 408.5 |
*C = complete, CE = contracts exchanged, STP = subject to planning, PG = planning granted, UC = under construction
In addition to this development pipeline, we continue to work with our JV partners in Italy and Germany to add to the portfolios of those ventures through incremental developments. In Germany in the first half of FY 2026 we opened two new stores taking the total to nine, with a further three stores under development.
In Italy we are in discussions regarding new development opportunities for the joint venture in undersupplied northern Italian cities which have the potential to add to the existing twelve-store portfolio. At this stage, six sites have been secured with development in progress on two.
CHIEF FINANCIAL OFFICER'S REVIEW
Underlying income statement
The table below sets out the Group's underlying results of operations for the six months to 30 April 2026 ("H1 2026") and the six months ended 30 April 2025 ("H1 2025"). To calculate the underlying performance metrics, adjustments are made for the impact of exceptional items, share-based payments, corporate transaction costs, change in fair value of derivatives, gain or loss on investment properties and the associate tax impacts, as well as exceptional tax items and deferred tax. Although not superseding IFRS, management considers this presentation of earnings to be representative of the underlying performance of the business, as it removes the income statement impact of items not fully controllable by management, such as the revaluation of derivatives and investment properties, and the impact of exceptional credits, costs and finance charges.
H1 2026 | H1 2025 | Mvmt | |||||||
£'m | £'m | % | |||||||
Revenue | 120.6 | 112.8 | 6.9% | ||||||
Underlying cost of sales | (41.7) | (38.1) | 9.4% | ||||||
Underlying store EBITDAR |
|
| 78.9 | 74.7 | 5.6% | ||||
Underlying administrative costs | (11.0) | (9.2) | 19.6% | ||||||
Underlying EBITDAR |
| 67.9 | 65.5 | 3.7% | |||||
Leasehold costs | (8.1) | (8.0) | 1.3% | ||||||
Underlying EBITDA after leasehold costs |
| 59.8 | 57.5 | 4.0% | |||||
Depreciation | (1.2) | (0.8) | 50.0% | ||||||
Net underlying finance charges | (14.0) | (13.0) | 7.7% | ||||||
Net contribution from joint ventures and associates | - | (0.1) | (100%) | ||||||
Underlying profit before tax |
| 44.6 | 43.6 | 2.3% | |||||
Current tax |
| (1.9) | (1.8) | 5.6% | |||||
Adjusted EPRA earnings |
| 42.7 | 41.8 | 2.1% | |||||
|
|
|
|
| |||||
Diluted shares (for ADE EPS) (m) | 219.9 | 219.7 | 0.1% | ||||||
| |||||||||
Adjusted diluted EPRA EPS (p) |
| 19.4 | 19.0 | 2.1% | |||||
The table below reconciles statutory profit before tax in the income statement to underlying profit before tax in the table above.
H1 2026 | H1 2025 | ||||
£'m | £'m | ||||
Statutory profit before tax | £36.3 | 97.0 | |||
Adjusted for | |||||
- loss/(gain) on investment properties and investment properties under construction | 7.0 | (54.6) | |||
- share of associate's non underlying income | (1.9) | - | |||
- share-based payments | 1.5 | 1.2 | |||
- exceptional items | 1.7 | - | |||
Underlying profit before tax | 44.6 | 43.6 | |||
Revenue and underlying profit by region
|
| ||||||||
H1 2026 | H1 2025 | ||||||||
UK | Paris | Exp Mkt | Total | UK | Paris | Exp Mkt | Total | ||
Total Revenue Local currency 'm | 83.9 | 26.7 | 15.4 | 81.2 | 25.5 | 12.2 | |||
| |||||||||
Average exchange rate |
| 1.195 | 1.195 |
|
| 1.195 | 1.195 |
| |
| |||||||||
Total Revenue (CER) £'m | 83.9 | 22.3 | 12.9 | 119.1 | 81.2 | 21.4 | 10.2 | 112.8 | |
| |||||||||
Underlying EBITDAR (CER) £'m | 47.2 | 13.5 | 6.2 | 66.9 | 47.2 | 13.9 | 4.4 | 65.5 | |
Foreign exchange | - | 0.7 | 0.3 | 1.0 | - | - | - | - | |
Underlying EBITDAR £'m | 47.2 | 14.2 | 6.5 | 67.9 | 47.2 | 13.9 | 4.4 | 65.5 | |
| |||||||||
Analysis of cost base
Cost of sales
|
|
| ||
H1 2026 | H1 2025 | Change | ||
£'m | £'m | £'m | % | |
Volume related costs including bad debt | 3.0 | 2.4 | 0.6 | 25.0% |
Store employees | 12.4 | 12.8 | (0.4) | (3.1%) |
Marketing | 5.0 | 4.7 | 0.3 | 6.4% |
Business rates | 9.9 | 9.4 | 0.5 | 5.3% |
Facilities and premises insurance | 8.4 | 8.0 | 0.4 | 5.0% |
Underlying LFL cost of sales (CER) | 38.7 | 37.3 | 1.4 | 3.8% |
Non LFL and developments | 2.6 | 0.8 | 1.8 | 225.0% |
Foreign exchange | 0.4 | - | 0.4 | N/A |
Underlying cost of sales | 41.7 | 38.1 | 3.6 | 9.4% |
Depreciation | 1.2 | 0.8 | 0.4 | 50.0% |
Total cost of sales | 42.9 | 38.9 | 4.0 | 10.3% |
| ||||
Cost of sales in the financial year continued to be impacted by elevated levels of inflationary cost pressures, particularly in the UK. This led to a 3.8% (CER) increase year on year in the underlying LFL cost of sales. The key drivers of this were:
· Volume related costs including bad debt: bad debt provision increased to 1.4% of revenue (H1 2025: 1.0%) reflecting phasing of costs in Paris in FY 2025 and improved unit recovery practices in Expansion Markets;
· Store employees: a 3.1% decrease year on year, driven by savings from headcount reduction (including full year impact of call centre redeployment) in the UK and savings from staff management in Paris offset by higher payroll costs in the UK from National Living Wage increases and rising employer National Insurance costs.
· Marketing: remained broadly stable at 4.2% of sales (H1 2025: 4.2%) reflecting our cost control and approach to securing customer enquiries in a cost-effective manner;
· Business rates: increased 5.3% with inflationary increases in the UK plus higher cost in Paris following successful rates assessment in H1 2025;
· Facilities and insurance: increased 5.0% in the half year due to the phasing of maintenance expenditure in Expansion Markets offset by savings in utilities in UK and Paris.
New stores classified as non-LFL incurred costs of £2.6 million in the year resulting in an overall increase in cost of sales of 10.3% to £42.9 million (H1 2025: £38.9 million).
Administrative Expenses
|
|
|
|
| ||
H1 2026 | H1 2025 | Change |
| |||
£'m | £'m | £'m | % |
| ||
Underlying administrative expenses (CER) | 10.9 | 9.2 | 1.7 | 18.5% | ||
Exceptional costs | 1.7 | - | 1.7 | - | ||
Share-based payments | 1.5 | 1.2 | 0.3 | 25.0% | ||
Foreign exchange | 0.1 | - | 0.1 | - | ||
| Total administrative expenses | 14.2 | 10.4 | 3.8 | 36.5% |
|
|
|
|
|
|
|
|
Administrative expenses comprise the head office costs of the Group. These costs include employee costs, listed company costs, professional fees and IT costs. The key centralised operations of the Group include marketing, price setting and IT carried out by specialist teams for all markets.
In H1 2026 underlying administrative costs grew £1.7m, up 18.5%. The key drivers were an increase in spend to enhance our capabilities in data management and support functions and the phasing of bonus recognition in the prior year.
Underlying administrative costs exclude exceptional items of £1.7 million comprising investment in a new SAAS-based finance computer system. The implementation of this system is expected to be completed in FY 2026 with further cost in H2 2026. These costs have been excluded from underlying performance due to their scale and irregular nature.
Investment Properties
A full, independent external valuation of the store portfolio is undertaken by the Group on an annual basis for year-end reporting. A sample of the Group's largest properties, representing approximately 33% of the value of the Group's investment property portfolio, has been valued by the Group's external valuers, Cushman & Wakefield Debenham Tie Leung Limited LLP ("C&W") as at 30 April 2026. In addition, at the same date, the Directors have prepared estimates of fair values for the remaining approximately 67% of the Group's investment property portfolio by updating 31 October 2025 valuations to incorporate latest trading performance.
|
|
|
|
|
| UK | Paris | Exp Mkt | Total IP |
| £'m | £'m | £'m | £'m |
Value of IP as at 1 November 2025 | 2,186.0 | 693.4 | 366.5 | 3,245.9 |
Developments and acquisitions* | 23.4 | 29.1 | 5.0 | 57.5 |
Disposals | - | - | - | - |
Revaluation | 1.3 | (3.7) | 0.2 | (2.2) |
Foreign exchange | - | (11.4) | (6.2) | (17.6) |
Value of IP as at 30 April 2026 | 2,210.7 | 707.4 | 365.5 | 3,283.6 |
IP under construction | 90.8 | 11.3 | 5.7 | 107.8 |
IP and IPUC, before lease liabilities | 2,301.5 | 718.7 | 371.2 | 3,391.4 |
IP lease liabilities | 86.1 | 19.3 | 9.6 | 115.0 |
Total as at 30 April 2026 | 2,387.6 | 738.0 | 380.8 | 3,506.4 |
|
|
|
|
|
* includes transfers from Investment Property Under Construction
Property Valuation: IP and IPUC, before lease liabilities
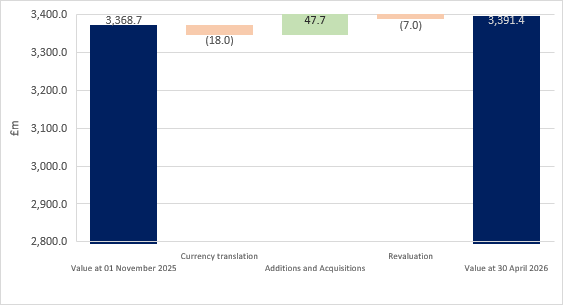
The Group's property portfolio valuation, including investment properties under construction, increased by £22.7 million, £47.7 million relating to additions and store refurbishments, a loss on revaluation of £7.0m and an £18.0 million decrease in the value of our investment properties due to foreign currency movements.
The revaluation loss equates to 0.2% of the Group's opening position and was principally attributable to the timing of development capex. The LFL portfolio valuation was stable year on year with average exit yield 5.33% (FY 2025: 5.32%) and discount rates for future cash flows of 9.02% (FY 2025: 9.02).
The exchange rate at 30 April 2026 was €1.1564 : £1 compared to €1.1375: £1 at 31 October 2025.
Loss on revaluation of properties
The result of the valuation approach outlined above was a revaluation loss comprised of:
H1 2026 | H1 2025 | |||||||
£'m | £'m | |||||||
Gross revaluation of investment properties | (2.2) | 21.1 | ||||||
Revaluation of investment properties under construction | (4.8) | 33.5 | ||||||
Fair value re-measurement of lease liabilities | (5.1) | (5.1) | ||||||
(Loss)/gain on revaluation of investment properties and investment properties under construction | (12.1) | 49.5 | ||||||
The fair value re-measurement of lease liabilities reflects the reduction in investment property lease liabilities as rent payments are made.
Joint Ventures and Associates
Half year 30 April 2026 | Italy | Germany | Total | ||
£'m | £'m | £'m | |||
Underlying share of joint venture and associate profit / (loss) | 0.1 | (0.1) | - | ||
Gain on revaluation of investment property | 1.5 | 0.4 | 1.9 | ||
Share of profit / (loss) from joint ventures and associates | 1.6 | 0.3 | 1.9 | ||
The underlying share of joint venture and associate profit reflects the 50% share of income from our Italian joint venture (following its acquisition in FY 2025) and the 10% share of income from our German associate. The result for the Italian JV includes the impact in the half of a full six months of the new stores opened in FY 2025 and the £1.5 million gain (at share) on the revaluation of the investment property of the joint venture, taking the total share of profit from joint ventures and associates to £1.9 million (FY 2025: £2.5 million).
Operating profit
Reported operating profit was £53.3 million for H1 2026, down from £112.9m in H1 2025 primarily due to a small revaluation loss on Investment Property in H1 2026 as compared to a gain in H1 2025.
A bridge from Underlying EBITDAR to operating profit can be found below:
|
| ||||
H1 2026 | H1 2025 | ||||
£'m | £'m | ||||
Underlying EBITDAR |
| 67.9 | 65.5 | ||
Adjusted for | |||||
(Loss) / gain on investment properties | (12.1) | 49.5 | |||
Share of non-underlying earnings from joint ventures and associates | 1.9 | (0.1) | |||
Depreciation | (1.2) | (0.8) | |||
Share-based payments | (1.5) | (1.2) | |||
Exceptional items | (1.7) | - | |||
Operating Profit | 53.3 | 112.9 | |||
Underlying finance income and costs
The underlying finance costs represent the finance expense before interest on obligations under lease liabilities, changes in fair value of derivatives and exceptional finance costs. It is disclosed as management reviews and monitors the performance of the business on this basis.
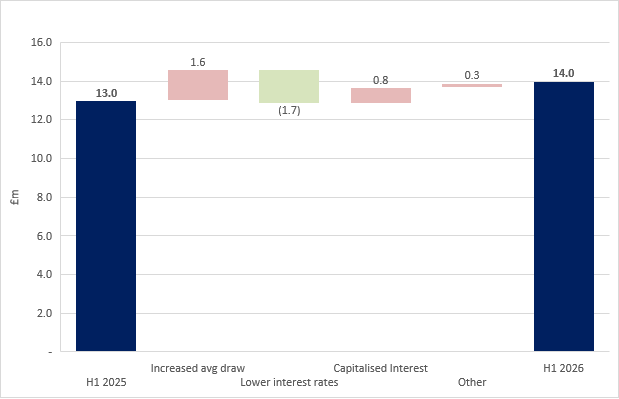
The underlying finance costs increased by £0.8 million to £14.1 million (H1 2025: £13.3 million). Interest payable decreased £0.1 million reflecting lower average borrowing costs offset by the Group's additional borrowings to fund the development programme. Average drawn debt for H1 2026 increased by £78.9 million year on year and this was offset by reducing average rate of debt, as base rates for our floating rate debt fell and we had the full year benefit of conversion of borrowings from GBP to EUR completed during H1 2025.
A reduction in the number of ongoing developments following our planned peak delivery year in FY 2025 led to a £0.8 million fall in interest capitalised on store developments.
Interest received of £0.1 million in H1 2026 principally reflects interest earned on loans to associates.
H1 2026 | H1 2025 | Change | ||||
£'m | £'m | £'m | % | |||
Interest received | 0.1 | 0.3 | (0.2) | (66.7%) | ||
| Underlying finance income | 0.1 | 0.3 | (0.2) | (66.7%) |
|
Interest payable | (15.3) | (15.4) | 0.1 | 0.6% | ||
Capitalised interest on developments | 2.0 | 2.8 | (0.8) | (28.6%) | ||
Amortisation of debt issuance costs on loans | (0.8) | (0.7) | (0.1) | (14.3%) | ||
| Underlying finance costs | (14.1) | (13.3) | (0.8) | 6.0% |
|
|
| |||||
| Net underlying finance costs | (14.0) | (13.0) | (1.0) | (7.7%) |
|
The movement in underlying net finance costs can be summarised as follows:
Underlying finance cost to net finance costs
Net finance costs include interest payable, interest on obligations under lease labilities, fair value movements on derivatives, exchange gains or losses, unwinding of discounts and exceptional finance income.
Interest on lease liabilities was £0.1 million higher totalling £3.0 million at H1 2026 and reflects part of the leasehold rental payment. The balance of the leasehold payment is charged through the gain or loss on investment properties in the income statement. Overall, the leasehold rent charge increased by £0.1 million to £8.1 million in H1 2026 (H1 2025: £8.0 million).
The Group undertakes net investment hedge accounting for its Euro denominated loan notes reflecting the natural currency hedge against Euro denominated assets.
Net finance costs increased by £1.1 million to £17.0 million in H1 2026 (H1 2025: £15.9 million).
H1 2026 | H1 2025 | Change | ||||
£'m | £'m | £'m | % | |||
| Total finance income | 0.1 | 0.3 | (0.2) | (66.7%) |
|
|
| |||||
Underlying finance costs | (14.1) | (13.3) | (0.8) | (6.0%) | ||
Interest on lease liabilities | (3.0) | (2.9) | (0.1) | (3.4%) | ||
| Total finance costs | (17.1) | (16.2) | (0.9) | (5.6%) |
|
| Net finance costs | (17.0) | (15.9) | (1.1) | (6.9%) |
|
|
| |||||
Tax
The tax charge for the period is analysed below:
|
|
|
| ||
| H1 2026 | H1 2025 |
| ||
| £'m | £'m |
| ||
Underlying current tax charge | 1.9 | 1.8 | |||
| Current tax charge |
| 1.9 | 1.8 |
|
|
|
|
|
|
|
Tax on investment properties movement | 1.3 | 15.5 | |||
Losses in respect of current year | (0.3) | 0.4 | |||
| Deferred tax charge |
| 1.0 | 15.9 |
|
|
|
|
|
|
|
| Net tax charge |
| 2.9 | 17.7 |
|
|
|
|
|
|
|
Net tax charge in the period of £2.9 million (H1 2025: £17.7 million).
The Group is a REIT with no tax charge on profits from its UK property rental business, so the current tax charge relates to Paris and Expansion Markets. The underlying current tax charge for the period amounted to £1.9 million (H1 2025: £1.8 million).
Profit after tax
The profit after tax for the period was £33.4 million, compared with £79.3 million in H1 2025, a decrease of £45.9 million which arose principally due to the revaluation loss on investment properties, which is explained above.
Earnings per Share
Basic EPS was 15.3 pence (H1 2025: 36.3 pence) and diluted EPS was 15.2 pence (H1 2025: 36.1 pence). As explained in note 2 to the financial statements, management considers Adjusted Diluted EPRA EPS to be more representative of the underlying EPS performance of the business.
Adjusted Diluted EPRA EPS is based on the European Public Real Estate Association's ("EPRA") definition of earnings and is defined as profit or loss for the period after tax excluding corporate transaction costs, changes in fair value of derivatives, exceptional and non-operating items, gain/loss on the fair value of investment properties and the associated tax impacts. The Company then makes further adjustments for the impact of share-based payment charges and deferred tax charges. This adjusted earnings figure is divided by the diluted number of shares. The share-based payment cost is excluded as it is written back to distributable reserves and is a non-cash item (with the exception of the associated National Insurance element). Therefore, neither the Company's ability to distribute nor pay dividends is impacted (with the exception of the associated National Insurance element). The financial statements disclose earnings on a statutory, EPRA and Adjusted Diluted EPRA basis and provide a full reconciliation of the differences in the financial year in which any Long Term Incentive Plan ("LTIP") awards may vest.
Management introduced Adjusted Diluted EPRA EPS as a measure of EPS following the implementation of the Group's LTIP schemes in 2017. Management considers that the real cost to existing shareholders from such schemes is the dilution that they will experience on the granting of shares. Therefore, earnings have been adjusted for the share-based payment charge and the number of shares used in the EPS calculation has also been adjusted for the dilutive effect of the LTIP schemes.
Adjusted Diluted EPRA EPS for the half year was 19.4 pence (H1 2025: 19.0 pence), calculated on a pro forma basis, as if the dilutive LTIP shares were in issue throughout both the current and prior years, as follows:
H1 2026 | H1 2025 | |||||
Earnings | Shares | Pence per | Earnings | Shares | Pence per | |
£'m | Million | share | £'m | Million | share | |
Basic EPS | 33.4 | 218.4 | 15.3 | 79.3 | 218.4 | 36.3 |
Adjustments: |
|
|
| |||
(Gain) / loss on revaluation of investment properties | 12.1 | - | 5.5 | (49.5) | - | (22.7) |
Fair value re-measurement of investment properties lease liabilities | (5.1) | - | (2.3) | (5.1) | - | (2.3) |
Exceptional Items | 1.7 | - | 0.8 | - | - | - |
Non underlying joint venture and associate earnings | (1.9) | - | (0.9) | - | - | - |
Tax on adjustments | 1.0 | - | 0.5 | 15.9 | - | 7.3 |
Adjusted Basic EPRA EPS | 41.2 | 218.4 | 18.9 | 40.6 | 218.4 | 18.6 |
Share-based payments charge | 1.5 | - | 0.7 | 1.2 | - | 0.5 |
Dilutive shares | - | 1.5 | (0.2) | - | 1.3 | (0.1) |
Adjusted Diluted EPRA EPS | 42.7 | 219.9 | 19.4 | 41.8 | 219.7 | 19.0 |
|
|
|
|
|
|
|
Dividends per share
The Board has announced an interim dividend of 10.2 pence per share (H1 2025: 10.1 pence per share). This will amount to a dividend payment of £22.3 million (H1 2025: £22.1 million). The dividend will be paid on 6 August 2026 with the record date of 3 July 2026 and an ex-dividend date of 2 July 2026. 25% (H1 2025: 25%) of the dividend will be paid as a REIT Property Income Distribution ("PID").
Gearing and Capital Structure
The Group finances its activities through a combination of equity and borrowings. As at 30 April 2026 the Group's borrowings comprise a Revolving Credit Facility "RCF" and a Term Loan together with US Private Placement notes "USPPs".
The drawn debt position as at 30 April 2026 is analysed as follows:
Facility | Drawn | Total Rate | |
£/€'m | £'m | % | |
USPP 2026 - October | €70.0 | £60.5 | 1.26% |
USPP 2027 | €74.1 | £64.1 | 2.00% |
USPP 2028 | €29.0 | £25.1 | 0.93% |
USPP 2029 | €105.0 | £90.8 | 2.45% |
USPP 2032 | €70.0 | £60.5 | 4.03% |
USPP 2033 | €29.0 | £25.1 | 1.42% |
USPP Total | €377.1 | £326.1 | 2.24% |
Term Loan Facility 2030 | €77.5 | £67.0 | 3.40% |
Total Fixed Rate EUR Debt | €454.6 | £393.1 | 2.44% |
% of total debt |
| 39.1% |
|
USPP 2026 - October | £35.0 | £35.0 | 2.59% |
USPP 2028 | £20.0 | £20.0 | 1.96% |
USPP 2029 | £50.5 | £50.5 | 2.92% |
USPP 2029 | £30.0 | £30.0 | 2.69% |
USPP 2031 | £80.0 | £80.0 | 2.39% |
Total Fixed Rate GBP Debt | £215.5 | £215.5 | 2.55% |
% of total debt |
| 21.5% | |
Total Fixed Rate Debt |
| £608.6 | 2.48% |
% of total debt |
| 60.6% |
|
| |||
RCF - GBP | £219.0 | £219.0 | 4.93% |
RCF - EUR | €204.0 | £176.4 | 3.21% |
RCF non-utilisation GBP | £104.6 | - | 0.42% |
| |||
Total Variable Rate Debt | £500.0 | £395.4 | 4.27% |
% of total debt |
| 39.4% |
|
|
|
| |
Total Debt |
| £1,004.0 | 3.18% |
Capitalised finance costs | - | (£4.0) | - |
Total Borrowings | £1,108.6 | £1,000.0 | 3.34% |
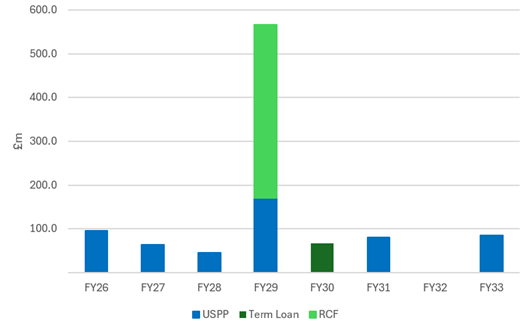
The debt repayment schedule can be summarised as follows ('£'m)
The committed facility in the RCF totals £500 million with an expiry in November 2028. As at 30 April 2026, £395.4 million of the £500.0 million RCF was drawn, split £219.0 million and €204.0 million (£176.4 million equivalent).
The Group pays interest on the RCF at an initial margin of 125bps plus SONIA or Euribor. The margin payable is linked to certain ESG targets, which have been met, enabling a reduction in the margin by 5bps to 120bps. In addition, the Group pays a non-utilisation fee of 0.42% on the undrawn facility balance.
USPPs are denominated in Euros and Sterling and incur fixed rates of interest. The Euro denominated USPPs total €377.1 million over six maturities from 2026 to 2033 with a weighted average interest cost of 2.24%. The Sterling denominated USPPs total £215.5 million with maturities between 2026 and 2031 and a weighted average interest rate of 2.55%. In addition, the Group has a 5-year floating rate Term loan totalling €77.5 million. This loan has been hedged with an interest rate swap with the resulting fixed interest cost of 3.40%.
As at 30 April 2026, 60.6% of the Group's drawn debt attracts fixed rates of interest. Overall, the Group has an effective interest rate on its borrowings of 3.34% as at 30 April 2026, compared with 3.46% at 31 October 2025.
The Euro denominated borrowings provide a natural currency hedge against the Group's investment in the Paris and Expansion Markets businesses. Euro denominated debt makes up 56.7% of total Group borrowings.
As at 30 April 2026, the weighted average remaining term for the Group's committed borrowing facilities is 3.0 years with the next maturities, both at 29 October 2026, comprising €70.0 million and £35.0 million USPPs. The weighted average interest rate on these USPPs is 1.75%. As current costs of borrowing are higher than this due to increased base rates, as these and subsequent USPPs are refinanced, there may be higher finance costs for the Group in 2027 and beyond. Following the balance sheet date, the Group arranged a new €150 million USPP for draw in October 2026 with a term of 5.6 years which will finance the upcoming maturities.
Net debt (including lease liabilities) stood at £1,100.8 million at 30 April 2026, an increase of £42.2 million during the half year, principally due to increased funding required for store acquisitions and developments. Net Debt (excluding lease liabilities) was £985.4 million.
Management measures leverage with reference to its loan to value ("LTV") ratio defined as net debt (excluding lease liabilities) as a proportion of the valuation of investment properties (excluding finance leases), including investment properties under construction. As at 30 April 2026, the Group LTV ratio was 29.1% compared with 28.1% at 31 October 2025.
The Board considers the current level of gearing is appropriate for the business to enable the Group to increase returns on equity, maintain financial flexibility and to achieve our medium-term strategic objectives.
Borrowings under the existing loan facilities are subject to certain financial covenants. The RCF, Term Loan and the USPPs share interest cover and LTV covenants. The interest cover requirement our financial covenants is a minimum EBITDA interest of 2.4x. Interest cover for H1 2026 was 3.9x (H1 2025: 3.9x).
The LTV covenant is 60% for the Group. As at 30 April 2026, there is significant headroom in the Group LTV covenant calculations.
Loan To Value
The following table sets out the drivers of the LTV, which comfortably sits below the Board's targeted 30% - 40% level at 29.1% at H1 2026 (27.4% at H1 2025).
H1 2026 | FY 2025 | ||||
£'m | £'m | ||||
Current borrowings | 95.5 | 96.5 | |||
Non-Current borrowings | 904.5 | 861.7 | |||
Cash and cash equivalents | (14.6) | (11.0) | |||
| Net debt excluding lease liabilities | 985.4 | 947.2 |
| |
Investment Properties and IPUC | 3,391.4 | 3,368.7 | |||
| Group Loan To Value | 29.1% | 28.1% |
| |
|
|
|
| ||
Interest Cover Ratio
The following table sets out the drivers of the ICR measure, which was 3.9x in H1 2026 (3.9x in H1 2025):
|
|
| ||
H1 2026 | H1 2025 |
| ||
£'m | £'m | |||
Underlying EBITDAR | 67.9 | 66.1 | ||
Leasehold costs | (8.1) | (8.0) | ||
Share-based payment national insurance charge | (0.1) | 0.2 | ||
| EBITDA (excluding share-based payment NI charge) | 59.7 | 58.3 |
|
Finance income | 0.1 | 0.3 | ||
Finance expense | (14.1) | (13.3) | ||
Capitalised Interest | (2.0) | (2.8) | ||
Amortisation of capitalised finance costs | 0.8 | 0.7 | ||
| Net interest | (15.2) | (15.1) |
|
| Interest Cover Ratio | 3.9x | 3.9x |
|
|
|
|
|
|
Cashflow
The table below sets out the cash flow of the business in H1 2026 and H1 2025
|
| |||||
| Group cash flow | |||||
|
| H1 2026 | H1 2025 | Change |
| |
|
| £'m | £'m | £'m | % | |
Underlying EBITDA | 67.9 | 65.5 | 2.4 | 3.7% | ||
Working capital / exceptionals / other | (1.7) | (5.4) | 3.7 | 68.5% | ||
| Cash generated from operations | 66.2 | 60.1 | 6.1 | 10.1% |
|
Interest payments | (14.4) | (14.4) | - | - | ||
Leasehold cost payments | (8.1) | (8.0) | (0.1) | (1.3%) | ||
Tax payments | (1.5) | (1.6) | 0.1 | 6.3% | ||
| Cash flow before investing activities | 42.2 | 36.1 | 6.1 | 16.9% |
|
Investment in joint ventures & associates | (1.0) | (36.8) | 35.8 | 97.3% | ||
Capex - investment properties | (45.5) | (58.0) | 12.5 | 21.6% | ||
Capex - property, plant and equipment | (0.7) | (1.1) | 0.4 | 36.4% | ||
| Adjusted net cash flow after investing activities | (5.0) | (59.8) | 54.8 | 91.6% |
|
Dividends paid | (41.8) | (39.5) | (2.3) | (5.8%) | ||
| Group cash outflow | (46.8) | (99.3) | 52.5 | 52.9% |
|
|
| |||||
Net drawdown of borrowings (net of fees) | (50.5) | (89.7) | ||||
|
|
|
|
|
|
|
| Movement in net debt | 42.2 | 100.2 |
|
|
|
Opening net debt | 1,058.6 | 824.2 | ||||
Closing net debt | 1,100.8 | 924.4 |
Cash generated from operations increased by £6.1m in the year as a result of improving EBITDA year on year.
Interest payments were stable versus prior year as a result of the increased interest charge associated with the additional borrowings to fund the capital expenditure on new stores offset by lower average borrowing costs in the half. With small increases in Leasehold payments, Cash flow before investing activities was £6.1m favourable year on year at £42.2 million (H1 2025: £36.1 million).
In the year, we invested £46.2 million (H1 2025: net outflow of £59.1 million) on capital expenditure, principally on the development of new stores. An additional £1.0 million was invested in joint ventures and associates relating to ongoing store developments.
Dividends paid to shareholders were £41.8 million in H1 2026 (£39.5 million in H1 2025), and the Group drew a net £50.5 million of borrowings to finance capital expenditure.
The table below reconciles cash flow before investing activities in the table above to net cash inflow from operating activities in the consolidated cash flow statement.
| H1 2026 | H1 2025 | ||||||||
| £'m | £'m | ||||||||
Cash flow before investing activities | 42.2 | 36.1 | ||||||||
Addback: Finance lease principal payments | 5.0 | 5.1 | ||||||||
Net cash inflow from operating activities | 47.2 | 41.2 | ||||||||
Cash flow before investing activities is shown after including the impact of finance lease principal payments as these are included in leasehold costs.
Consolidated income statement
for the half year ended 30 April 2026 (unaudited)
Half year ended30 April 2026 | Half year ended30 April 2025 | ||
(unaudited) | (unaudited) | ||
Note | £'m | £'m | |
Revenue | 4,5 | 120.6 | 112.8 |
Cost of sales | (42.9) | (38.9) | |
Gross profit | 77.7 | 73.9 | |
Administrative expenses | (14.2) | (10.4) | |
Share of profit/(loss) from joint ventures and associates | 11, 12 | 1.9 | (0.1) |
Operating profit before (loss)/gain on investment properties | 65.4 | 63.4 | |
(Loss)/gain on revaluation of investment properties | 13 | (12.1) | 49.5 |
Operating profit | 5 | 53.3 | 112.9 |
Finance income | 6 | 0.1 | 0.3 |
Finance expense | 6 | (17.1) | (16.2) |
Profit before income tax | 36.3 | 97.0 | |
Income tax charge | 7 | (2.9) | (17.7) |
Profit for the period | 33.4 | 79.3 | |
Earnings per share for profit attributable to the equity holders |
| ||
- basic (pence) | 10 | 15.3 | 36.3 |
- diluted (pence) | 10 | 15.2 | 36.1 |
The financial results for both periods relate to continuing operations.
Consolidated statement of comprehensive income
for the half year ended 30 April 2026 (unaudited)
Half yearended30 April2026 | Half yearended30 April2025 | |
(unaudited) | (unaudited) | |
£'m | £'m | |
Profit for the period | 33.4 | 79.3 |
Other comprehensive income: |
| |
Items that may be reclassified subsequently to profit and loss: |
| |
Currency translation differences | (12.3) | 9.3 |
Net investment hedge | 6.1 | (6.0) |
Cash flow hedge | 1.6 | - |
Total other comprehensive (expense)/income net of tax | (4.6) | 3.3 |
Total comprehensive income for the period | 28.8 | 82.6 |
Consolidated balance sheet
Company registration number: 04726380
as at 30 April 2026 (unaudited) | 30 April2026 | 30 April2025 | 31 October2025 | |
(unaudited) | (unaudited) | (audited) | ||
Note | £'m | £'m | £'m | |
Assets |
| |||
Non-current assets |
| |||
Investment in associates | 11 | 7.8 | 6.3 | 6.5 |
Investment in joint ventures | 12 | 45.2 | 37.8 | 44.4 |
Investment properties | 13 | 3,506.4 | 3,413.0 | 3,480.1 |
Property, plant and equipment | 7.3 | 6.5 | 7.2 | |
Derivative financial instruments | 1.6 | - | - | |
Deferred tax assets | 9 | 9.1 | 5.9 | 8.8 |
3,577.4 | 3,469.5 | 3,547.0 | ||
Current assets |
| |||
Inventories | 0.4 | 0.4 | 0.4 | |
Current tax assets | 1.3 | 0.3 | 1.0 | |
Trade and other receivables | 27.0 | 34.6 | 31.6 | |
Cash and cash equivalents | 14.6 | 16.9 | 11.0 | |
43.3 | 52.2 | 44.0 | ||
Total assets | 3,620.7 | 3,521.7 | 3,591.0 | |
Current liabilities |
| |||
Borrowings | 16 | (95.5) | - | (96.5) |
Trade and other payables | (53.7) | (52.7) | (54.0) | |
Current tax liabilities | (0.5) | - | - | |
Obligations under lease liabilities | (15.2) | (14.5) | (15.4) | |
(164.9) | (67.2) | (165.9) | ||
Non-current liabilities |
| |||
Borrowings | 16 | (904.5) | (924.4) | (861.7) |
Deferred tax liabilities | 9 | (175.2) | (173.0) | (176.7) |
Obligations under lease liabilities | (100.2) | (88.4) | (96.0) | |
Provisions | 18 | (2.3) | (2.3) | (2.3) |
(1,182.2) | (1,188.1) | (1,136.7) | ||
Total liabilities | (1,347.1) | (1,255.3) | (1,302.6) | |
Net assets | 15 | 2,273.6 | 2,266.4 | 2,288.4 |
Shareholders' equity |
| |||
Ordinary shares | 17 | 2.2 | 2.2 | 2.2 |
Share premium | 62.7 | 62.7 | 62.7 | |
Translation reserve | 6.5 | 0.9 | 12.7 | |
Cash flow hedge reserve | 1.6 | - | - | |
Retained earnings | 2,200.6 | 2,200.6 | 2,210.8 | |
Total equity | 2,273.6 | 2,266.4 | 2,288.4 |
These financial statements were authorised for issue by the Board of Directors on 10 June 2026 and signed on its behalf by:
S Clinton F Vecchioli
Chief Financial Officer Chief Executive Officer
Consolidated statement of changes in shareholders' equity
for the half year ended 30 April 2026 (unaudited)
Condensed consolidated statement of changes in equity
for the half year ended 30 April 2026
Share capital | Share premium | Translation reserve | Cash flow hedge reserve | Retained earnings | Total equity | |
£'m | £'m | £'m | £'m | £'m | £'m | |
Balance at 1 November 2025 | 2.2 | 62.7 | 12.7 | - | 2,210.8 | 2,288.4 |
Profit for the period | - | - | - | - | 33.4 | 33.4 |
Other comprehensive income for the period | - | - | (6.2) | 1.6 | - | (4.6) |
Total comprehensive income for the period | - | - | (6.2) | 1.6 | 33.4 | 28.8 |
Transactions with owners in their capacity as owner: |
| |||||
Dividends | - | - | - | - | (45.0) | (45.0) |
Employee share options | - | - | - | - | 1.4 | 1.4 |
Balance at 30 April 2026 | 2.2 | 62.7 | 6.5 | 1.6 | 2,200.6 | 2,273.6 |
Condensed consolidated statement of changes in equity
for the half year ended 30 April 2025
Share capital | Share Premium | Translation reserve | Cash flow hedge reserve | Retained earnings | Total equity | |
£'m | £'m | £'m | £'m | £'m | £'m | |
Balance at 1 November 2024 | 2.2 | 62.7 | (2.4) | - | 2,164.3 | 2,226.8 |
Profit for the period | - | - | - | - | 79.3 | 79.3 |
Other comprehensive income for the period | - | - | 3.3 | - | - | 3.3 |
Total comprehensive income for the period | - | - | 3.3 | - | 79.3 | 82.6 |
Transactions with owners in their capacity as owner: | ||||||
Dividends | - | - | - | - | (44.5) | (44.5) |
Employee share options | - | - | - | - | 1.5 | 1.5 |
Balance at 30 April 2025 | 2.2 | 62.7 | 0.9 | - | 2,200.6 | 2,266.4 |
Consolidated cash flow statement
for the half year ended 30 April 2026 (unaudited)
| Half yearended30 April2026 | Half yearended30 April2025 | |
| (unaudited) | (unaudited) | |
Note | £'m | £'m | |
Profit before income tax |
| 36.3 | 97.0 |
Loss/(gain) on the revaluation of investment properties |
| 12.1 | (49.5) |
Share of (profit)/loss from joint ventures and associates |
| (1.9) | 0.1 |
Depreciation |
| 1.2 | 0.8 |
Net finance expense |
| 17.0 | 15.9 |
Employee share options |
| 1.4 | 1.4 |
Decrease/(increase) in trade and other receivables |
| 4.3 | (2.4) |
Decrease in trade and other payables |
| (4.2) | (3.2) |
Cash flows from operating activities |
| 66.2 | 60.1 |
Interest received |
| 0.1 | 0.3 |
Interest paid |
| (17.6) | (17.6) |
Tax paid |
| (1.5) | (1.6) |
Net cash inflow from operating activities |
| 47.2 | 41.2 |
Cash flows from investing activities |
|
| |
Investment in joint ventures and associates | 12 | (1.0) | (36.8) |
Expenditure on investment and development properties | 13 | (45.5) | (58.0) |
Purchase of property, plant and equipment |
| (0.7) | (1.1) |
Net cash outflow from investing activities |
| (47.2) | (95.9) |
Cash flows from financing activities |
|
| |
Equity dividends paid |
| (41.8) | (39.5) |
Net drawdown of borrowings |
| 50.5 | 90.0 |
Debt issuance costs |
| - | (0.3) |
Principal payment of lease liabilities |
| (5.0) | (5.1) |
Net cash inflow from financing activities |
| 3.7 | 45.1 |
Net increase / (decrease) in cash and cash equivalents |
| 3.7 | (9.6) |
Exchange (loss)/gain on cash and cash equivalents |
| (0.1) | 1.2 |
Opening cash and cash equivalents as 1 November |
| 11.0 | 25.3 |
Closing cash and cash equivalents at 31 October |
| 14.6 | 16.9 |
Notes to the financial statements
for the half year ended 30 April 2026
1. General Information
The Company is a public limited company incorporated and domiciled in the UK. The address of its registered office is Brittanic House, Stirling Way, Borehamwood, Hertfordshire WD6 2BT.
The Company is listed on the London Stock Exchange.
The interim report was approved for issue on 10 June 2026.
This condensed consolidated interim financial information does not comprise statutory accounts within the meaning of section 434 of the Companies Act 2006. The full accounts of Safestore Holdings plc for the year ended 31 October 2025, which received an unqualified report from the auditor, and did not contain a statement under S.498(2) or (3) of the Companies Act 2006, were filed with the Registrar of Companies on 29 March 2026. This condensed consolidated interim financial information for 30 April 2026 and 30 April 2025 is unaudited. The interim financial information for 30 April 2026 has been reviewed by the auditor and their independent Review report is included within this financial information.
2. Basis of preparation
The condensed consolidated interim financial information for the half year ended 30 April 2026 has been prepared in accordance with the Disclosure and Transparency Rules of the United Kingdom's Financial Conduct Authority and with United Kingdom adopted International Accounting Standard 34 'Interim Financial Reporting' (IAS 34).
Going Concern
The Directors are satisfied that the Group has sufficient resources to continue in operation for the foreseeable future, a period of not less than twelve months from the date of this report. Accordingly, they continue to adopt the going concern basis in preparing this consolidated financial information.
In assessing the Group's going concern position as at 30 April 2026, the Directors have considered a number of factors, including the current balance sheet position, the principal and emerging risks which could impact the performance of the Group and the Group's strategic and financial plan. Consideration has been given to compliance with borrowing covenants along with the uncertainty inherent in future financial forecasts. The Directors considered the most recent three-year financial plans approved by the Board, in particular the projections for the period to 30 April 2028. The Directors note that the Group has USPPs totalling £95.5 million maturing on 30 October 2026 with a further £64.1 million maturing on 31 May 2027 and have arranged for new USPP financing of €150 million to commence in October 2026 to add further liquidity to the Group supplementing the £104 million undrawn RCF. The financial position of the Group, including details of its financing and capital structure, is set out in the financial review section of this report. Further details of the Group's viability statement are included in page 44 of the Annual Report and Financial Statements for the year ended 31 October 2025.
Non-GAAP financial information/Alternative Performance Measures
The Directors have identified certain measures that they believe will assist the understanding of the performance of the business. The measures are not defined under IFRS and they may not be directly comparable with other companies' adjusted measures. The non-GAAP/Alternative Performance Measures are not intended to be a substitute for, or superior to, any IFRS measures of performance but they have been included as the Directors consider them to be important comparables and key measures used within the business for assessing performance. The following are the key non-GAAP/Alternative Performance Measures identified by the Group:
• The Group defines exceptional items to be those that warrant, by virtue of their nature, size or frequency, separate disclosure on the face of the income statement where, in the opinion of the Directors, this enhances the understanding of the Group's financial performance.
• Underlying EBITDAR is an Alternative Performance Measure and is defined as operating profit before exceptional items, share-based payments, corporate transaction costs, change in value of derivatives, gain/loss on investment properties, depreciation, net profit from joint ventures and associates, interest and tax. Management considers this presentation to be representative of the underlying performance of the business, as it removes the income statement impact of items not fully controllable by management, such as the revaluation of investment properties, and the impact of exceptional credits, costs and finance charges. A reconciliation of statutory operating profit to Underlying EBITDAR can be found in the financial review of this announcement.
• Adjusted Diluted EPRA Earnings per Share is based on the European Public Real Estate Association's definition of earnings and is defined as profit or loss for the period after tax but excluding corporate transaction costs, exceptional and non-operating items, gain/loss on investment properties and the associated tax impacts. The Company then makes further company-specific adjustments for the impact of net exchange gains/losses recognised in net finance costs and deferred and current tax in respect of these adjustments. The Company also adjusts for IFRS 2 share-based payment charges. This adjusted earnings is divided by the diluted number of shares. The IFRS 2 cost is excluded as it is written back to distributable reserves and is a non-cash item (with the exception of the associated National Insurance element). Therefore, neither the Company's ability to distribute nor pay dividends are impacted (with the exception of the associated National Insurance element). The financial statements disclose earnings on a statutory, EPRA and Adjusted Diluted EPRA basis and will provide a full reconciliation of the differences in the financial year in which any LTIP awards may vest. A reconciliation of statutory Basic Earnings per Share to Adjusted Diluted EPRA Earnings per Share can be found in note 10.
• EPRA's Best Practices Recommendations guidelines for Net Asset Value ("NAV") metrics are EPRA Net Tangible Assets ("NTA"), EPRA Net Reinstatement Value ("NRV") and EPRA Net Disposal Value ("NDV"). EPRA NTA is considered to be the most relevant measure for the Group's business which provides sustainable long term progressive returns and is the primary measure of net assets. The basis of calculation, including a reconciliation to reported net assets, is set out in note 15.
• Like-for-like figures are presented to aid in the comparability of the underlying business as they exclude the impact on results of purchased, sold, opened or closed stores.
• Constant exchange rate ("CER") figures are provided in order to present results on a more comparable basis, removing foreign exchange movements.
Forward-looking statements
Certain statements in this preliminary announcement are forward-looking. Although the Group believes that the expectations reflected in these forward-looking statements are reasonable, we can give no assurance that these expectations will prove to have been correct.
Because these statements involve risks and uncertainties, actual results may differ materially from those expressed or implied by these forward-looking statements. We undertake no obligation to update any forward-looking statements whether as a result of new information, future events or otherwise.
3. Accounting policies
The condensed consolidated interim financial information has been prepared on the basis of the accounting policies expected to apply for the financial year to 31 October 2026 and the same as applied for the Group's Financial Statements for the Full Year October 2025 applicable to companies under IFRS.
The preparation of financial statements in conformity with generally accepted accounting principles requires the use of certain critical accounting estimates. It also requires management to exercise judgement in the process of applying the Company's accounting policies. The areas involving a higher degree of judgement or complexity, or areas where assumptions and estimates are significant to the condensed consolidated interim financial statements are disclosed within the Group's accounting policies as disclosed in the IFRS financial statements for the year ended 31 October 2025. There have been no other significant changes in accounting estimates in the period.
The same accounting policies, presentation and methods of computation are followed in the condensed set of financial statements as applied in the Group's latest financial statements. The nature of the Critical Accounting Judgements and Key Sources of Estimation Uncertainty applied in the condensed financial statements have remained consistent with those applied in the Group's latest annual audited financial statements.
4. Revenue
Analysis of the Group's operating revenue can be found below:
Half yearended30 April 2026 | Half yearended30 April 2025 | |
(unaudited) | (unaudited) | |
£'m | £'m | |
Self-storage income | 101.5 | 94.4 |
Customer goods protection | 12.8 | 12.7 |
Other non-storage income | 6.3 | 5.7 |
Total revenue | 120.6 | 112.8 |
Other non-storage income includes fees earned from the management of self-storage businesses carried on by joint ventures and associates and from sales of merchandise.
5. Segmental analysis
The Group's revenue, profit before income tax and net assets are attributable to one activity: the provision of self-storage accommodation and related services. This is based on the Group's management and internal reporting structure.
Safestore is organised and managed in three operating segments, based on geographical areas, being the United Kingdom, Paris in France and Expansion Markets (Spain, the Netherlands and Belgium).
The chief operating decision maker, being the Executive Directors, assesses the performance of the operating segments on the basis of Underlying EBITDAR, which is defined as operating profit before exceptional items, share-based payments, corporate transaction costs, change in value of derivatives, gain/loss on investment properties, depreciation, net profit from joint ventures and associates, interest and tax.
The operating profits and assets include items directly attributable to a segment as well as those that can be allocated on a reasonable basis.
Half year ended 30 April 2026 (unaudited) | UK £'m | Paris £'m | Expansion Markets £'m | Group £'m |
Continuing operations | ||||
Revenue | 83.9 | 23.2 | 13.5 | 120.6 |
Underlying EBITDAR | 47.2 | 14.2 | 6.5 | 67.9 |
Share-based payments | (1.6) | 0.1 | - | (1.5) |
Exceptional costs | (1.7) | - | - | (1.7) |
Depreciation | (1.0) | (0.1) | (0.1) | (1.2) |
Share of joint venture and associates profit | - | - | 1.9 | 1.9 |
Loss on investment properties | (7.8) | (4.0) | (0.3) | (12.1) |
Operating profit | 35.1 | 10.2 | 8.0 | 53.3 |
Net finance expense | (12.5) | (1.8) | (2.7) | (17.0) |
Profit before tax | 22.6 | 8.4 | 5.3 | 36.3 |
Total investment properties | 2,387.6 | 738.0 | 380.8 | 3,506.4 |
Total investments in joint ventures and associates | - | 1.8 | 51.2 | 53.0 |
Half year ended 30 April 2025 (unaudited) | UK £'m | Paris £'m | Expansion Markets £'m | Group £'m |
Continuing operations | ||||
Revenue | 81.2 | 21.4 | 10.2 | 112.8 |
Underlying EBITDAR | 47.1 | 13.9 | 5.1 | 66.1 |
Share-based payments | (1.5) | 0.3 | - | (1.2) |
Exceptional costs | - | - | - | - |
Depreciation | (0.7) | (0.1) | - | (0.8) |
Share of joint venture' and associates loss | (0.1) | - | (0.6) | (0.7) |
Gain/(loss) on investment properties | (4.0) | 27.7 | 25.8 | 49.5 |
Operating profit | 40.8 | 41.8 | 30.3 | 112.9 |
Net finance expense | (12.1) | (1.5) | (2.3) | (15.9) |
Profit before tax | 28.7 | 40.3 | 28.0 | 97.0 |
Total investment properties | 2,326.1 | 721.6 | 365.3 | 3,413.0 |
Total investments in joint ventures and associates | - | 1.8 | 42.3 | 44.1 |
Inter-segment transactions are entered into under the normal commercial terms and conditions that would also be available to unrelated third parties. There is no material impact from inter-segment transactions on the Group's results.
6. Finance income and costs
Half yearended30 April2026 | Half yearended30 April2025 |
| |
(unaudited) | (unaudited) |
| |
£'m | £'m |
| |
Finance income | |||
Other interest and similar income | - | 0.1 | |
Interest receivable from loan to associates | 0.1 | 0.2 | |
Underlying finance income | 0.1 | 0.3 | |
Total finance income | 0.1 | 0.3 | |
Finance costs |
| ||
Interest payable on borrowings | (13.3) | (12.6) | |
Amortisation of debt issuance costs on borrowings | (0.8) | (0.7) | |
Underlying finance charges | (14.1) | (13.3) | |
Interest on lease liabilities | (3.0) | (2.9) | |
Total finance cost | (17.1) | (16.2) | |
Net finance costs | (17.0) | (15.9) | |
The capitalisation rate of interest is based on the incremental cost of RCF borrowings.
7. Income tax charge
Analysis of tax charge in the period:
Half yearended30 April2026 | Half yearended30 April2025 | |
(unaudited) | (unaudited) | |
£'m | £'m | |
Current tax: |
| |
- current period | (1.9) | (1.8) |
- prior period | - | - |
| ||
Deferred tax: |
| |
- current period | (1.3) | (15.5) |
- prior period | 0.3 | (0.4) |
|
| |
Tax charge | (2.9) | (17.7) |
The Group is a UK real estate investment trust ("REIT"). As a result, the Group is exempt from UK corporation tax on the profits and gains from its qualifying property rental business in the UK, providing it meets certain conditions. Non-qualifying profits and gains of the Group remain subject to corporation tax as normal. The Group monitors its compliance with the REIT conditions. There have been no breaches of the conditions to date.
Taxation for other jurisdictions is calculated at the rates prevailing in the respective jurisdictions.
8. Dividends per share
An interim dividend of 10.2 pence per ordinary share (30 April 2025: 10.1 pence) has been declared. The ex-dividend date will be 2 July 2026 and the record date 3 July 2026, with an intended payment date of 6 August 2026. It is intended that 25% (30 April 2025: 25%) of the interim dividend of 10.2 pence per ordinary share (30 April 2025: 10.1 pence) will be paid as a REIT Property Income Distribution ("PID") net of withholding tax where appropriate.
The interim dividend, amounting to £22.3 million (30 April 2025: £22.1 million), has not been included as a liability at 30 April 2026. It will be recognised in shareholders' equity in the year to 31 October 2026.
9. Deferred tax
As at30 April2026 | As at30 April2025 | As at31 October 2025 | |
(unaudited) | (unaudited) | (audited) | |
£'m | £'m | £'m | |
The amounts provided in the accounts are: |
| ||
| |||
Revaluation of investment properties and tax depreciation | (175.2) | (173.0) | (176.7) |
Deferred tax liabilities | (175.2) | (173.0) | (176.7) |
| |||
Tax losses | 9.0 | 5.3 | 8.1 |
Other timing differences | 0.1 | 0.6 | 0.7 |
Deferred tax assets | 9.1 | 5.9 | 8.8 |
| |||
Net deferred tax liability | (166.1) | (167.1) | (167.9) |
As at 30 April 2026, the Group had trading losses of £43.7 million (30 April 2025: £32.9 million) and capital losses of £36.4 million (30 April 2025: £36.4 million) in respect of its UK operations. All losses can be carried forward indefinitely. A deferred tax asset of £9.1 million (31 October 2025: £8.8 million) has been recognised in respect of these losses, recognising the extent to which the Group believes these losses will be utilised in the future to reduce income tax liabilities.
10. Earnings per Share
Basic Earnings per Share ("EPS") is calculated by dividing the profit attributable to equity holders of the Company by the weighted average number of ordinary shares in issue during the year excluding ordinary shares held as treasury shares. Diluted EPS is calculated by adjusting the weighted average number of ordinary shares to assume conversion of all dilutive potential shares. The Company has one category of dilutive potential ordinary shares: share options. For the share options, a calculation is performed to determine the number of shares that could have been acquired at fair value (determined as the average annual market price of the Company's shares) based on the monetary value of the subscription rights attached to the outstanding share options. The number of shares calculated as above is compared with the number of shares that would have been issued assuming the exercise of the share options.
Half year ended 30 April 2026 (unaudited) | Half year ended 30 April 2025 (unaudited) | ||||||
| Earnings £'m | Shares million | Pence per share |
| Earnings £'m | Shares million | Pence per share |
Basic EPS | 33.4 | 218.4 | 15.3 | 79.3 | 218.4 | 36.3 | |
Dilutive securities | - | 1.5 | (0.1) |
| - | 1.3 | (0.2) |
Diluted EPS | 33.4 | 219.9 | 15.2 |
| 79.3 | 219.7 | 36.1 |
Adjusted Earnings per Share
Explanations related to the adjusted earnings measures adopted by the Group are set out in note 2 under the heading, Non-GAAP financial information/Alternative Performance Measures. Adjusted EPS represents profit after tax adjusted for the valuation movement on investment properties, exceptional items, non-underlying joint venture and associate earnings, and exchange gains/losses.
The Directors consider that these alternative measures provide useful information on the performance of the Group. EPRA earnings and Earnings per Share before non-recurring items, movements on revaluations of investment properties have been disclosed to give a clearer understanding of the Group's underlying trading performance.
Half year ended 30 April 2026 (unaudited) | Half year ended 30 April 2025 (unaudited) | ||||||
| Earnings £'m | Shares million | Pence per share |
| Earnings £'m | Shares million | Pence per share |
Basic EPS | 33.4 | 218.4 | 15.3 | 79.3 | 218.4 | 36.3 | |
Adjustments: |
| ||||||
Loss/(gain) on revaluation of investment properties | 12.1 | - | 5.5 | (49.5) | - | (22.7) | |
Exceptional items | 1.7 | - | 0.8 | - | - | - | |
Fair value re-measurement of investment properties lease liabilities | (5.1) | - | (2.3) | (5.1) | - | (2.3) | |
Non-underlying joint venture and associate earnings | (1.9) | - | (0.9) | - | - | - | |
Tax on adjustments | 1.0 | - | 0.5 | 15.9 | - | 7.3 | |
Adjusted Basic EPRA EPS | 41.2 | 218.4 | 18.9 | 40.6 | 218.4 | 18.6 | |
Share-based payments charge | 1.5 | - | 0.7 | 1.2 | - | 0.5 | |
Dilutive shares | - | 1.5 | (0.2) |
| - | 1.3 | (0.1) |
Adjusted Diluted EPRA EPS1 | 42.7 | 219.9 | 19.4 |
| 41.8 | 219.7 | 19.0 |
Note 1:
Adjusted Diluted EPRA EPS is based on the European Public Real Estate Association's definition of earnings and is defined as profit or loss for the period after tax but excluding corporate transaction costs, change in fair value of derivatives, gain/loss on investment properties and the associated tax impacts. The Company then makes further adjustments for the impact of exceptional items, IFRS 2 share-based payment charges, exceptional tax items, and deferred tax charges. This adjusted earnings is divided by the diluted number of shares. The IFRS 2 cost is excluded as it is written back to distributable reserves and is a non-cash item (with the exception of the associated National Insurance element). Therefore, neither the company's ability to distribute nor pay dividends are impacted (with the exception of the associated National Insurance element). The financial statements disclose earnings both on a statutory, EPRA and Adjusted Diluted EPRA basis and will provide a full reconciliation of the differences in the financial year in which any LTIP awards may vest.
Loss on revaluation of investment properties includes the fair value re-measurement of investment properties lease liabilities of £5.1 million (H1 2025: £5.1 million) and the related tax thereon of £0.6 million (H1 2025: £0.5 million). As an industry standard measure, EPRA earnings is presented. EPRA earnings of £41.2 million (H1 2025: £40.6 million) and EPRA Earnings per Share of 18.9 pence (H1 2025: 18.6 pence) are calculated after further adjusting for these items.
11. Investment in associates
PBC | CERF II | Total | |
Half year to 30 April 2026 (unaudited) | £'m | £'m | £'m |
At 1 November 2025 | 1.8 | 4.7 | 6.5 |
Additions | - | 1.0 | 1.0 |
Share of profit | - | 0.3 | 0.3 |
Exchange movements | - | - | - |
At 30 April 2026 | 1.8 | 6.0 | 7.8 |
PBC | CERF II | Total | |
Half year to 30 April 2025 (unaudited) | £'m | £'m | £'m |
At 1 November 2024 | 1.8 | 4.8 | 6.6 |
Additions | - | (0.4) | (0.4) |
Share of loss | - | (0.2) | (0.2) |
Exchange movements | - | 0.3 | 0.3 |
At 30 April 2025 | 1.8 | 4.5 | 6.3 |
PBC | CERF II | Total | |
Full year to 31 October 2025 (audited) | £'m | £'m | £'m |
At 1 November 2024 | 1.8 | 4.8 | 6.6 |
Additions | - | - | - |
Share of loss | - | (0.4) | (0.4) |
Exchange movements | - | 0.3 | 0.3 |
At 31 October 2025 | 1.8 | 4.7 | 6.5 |
Below is a reconciliation of IFRS to EPRA share of profits for each associate:
PBC | CERF II | Total | ||||
H1 2026 (unaudited) | H1 2025 (unaudited) | H1 2026 (unaudited) | H1 2025 (unaudited) | H1 2026 (unaudited) | H1 2025 (unaudited) | |
Group's share | £'m | £'m | £'m | £'m | £'m | £'m |
Statutory profit/(loss) after tax | - | - | 0.3 | (0.2) | 0.3 | (0.2) |
Adjusted for: |
|
| ||||
Gain on investment properties and investment properties under construction | - | - | (0.4) | - | (0.4) | - |
Adjusted Basic EPRA earnings | - | - | (0.1) | (0.2) | (0.1) | (0.2) |
PBC Les Groues SAS
The Group has a 24.9% interest in PBC Les Groues SAS ("PBC"), a company registered and operating in France. PBC is accounted for using the equity method of accounting. PBC is the parent company of Nanterre FOCD 92, a company also registered and operating in France, which finished developing one new store in FY 2025 and continues its wider development programme located in Paris. The development project is managed by its joint venture partners, therefore the Group has no operational liability during this phase. During the current period there has been no additional investment in the company (30 April 2025: £nil). The aggregate carrying value of the Group's interest in PBC was £1.8 million (30 April 2025: £1.8 million). The Group's share of profits from continuing operations for the period was £nil (30 April 2025: £nil). The Group's share of total comprehensive income of associates for the period was £nil (30 April 2025 £nil).
CERF II German Storage Topco S.a.r.l.
The Group has a 10.0% interest in CERF II German Storage Topco S.a.r.l. ("CERF II"), a company registered in Luxembourg for which the Group has board representation. The reporting date of the financial statements for the company is 31 December. CERF II is accounted for using the equity method of accounting. The aggregate carrying value of the Group's interest in CERF II was £6.0 million (30 April 2025: £4.5 million). The Group's share of profits from continuing operations for the period was £0.3 million (30 April 2025: share of loss of £0.2 million). The Group's share of total comprehensive income of associates for the period was £0.3 million (30 April 2025: £0.2 million).
12. Investment in joint ventures
EasyBox | |
Half year to 30 April 2026 (unaudited) | £'m |
At 1 November 2025 | 44.4 |
Additions | - |
Share of profit | 1.6 |
Exchange movements | (0.8) |
At 30 April 2026 | 45.2 |
EasyBox | |
Half year to 30 April 2025 (unaudited) | £'m |
At 1 November 2024 | - |
Additions | 36.8 |
Share of profit | 0.2 |
Exchange movements | 0.8 |
At 30 April 2025 | 37.8 |
EasyBox | |
Full year to 31 October 2025 (audited) | £'m |
At 1 November 2024 | - |
Additions | 38.9 |
Share of profit | 2.9 |
Exchange movements | 2.6 |
At 31 October 2025 | 44.4 |
This is a reconciliation of IFRS to EPRA share of profits for the joint venture:
EasyBox | ||
H1 2026 (unaudited) | H1 2025 (unaudited) | |
Based on the Group's share of profits | £'m | £'m |
Statutory profit after tax | 1.6 | 0.2 |
Adjusted for: |
| |
Gain on investment properties and investment properties under construction | (1.5) | - |
Adjusted Basic EPRA earnings | 0.1 | 0.2 |
| ||
EasyBox
The Group has a 50% interest in EasyBox Self-Storage1, registered in Italy. The reporting date of the financial statements of EasyBox is 31 December. EasyBox is accounted for using the equity method of accounting. The aggregate carrying value of the Group's interest in EasyBox was £45.2 million (30 April 2025: £37.8 million). The Group's share of profits from continuing operations for the period was £1.6 million (30 April 2025: £0.2 million). The Group's share of total comprehensive income of joint ventures for the period was £1.6 million (30 April 2025: £0.2 million).
Note:
1 EasyBox Self-Storage refers to the Group's investments in EasyBox Self-Storage S.p.A. and the Italian Self Storage Fund - Fondo di Investimento Alternativo Immobiliare Riservato.
13. Investment properties
| Investment properties, net of lease liabilities £'m | Investment properties lease liabilities £'m | Investment property under construction £'m | Total investment properties £'m |
At 1 November 2025 | 3,245.9 | 111.5 | 122.8 | 3,480.2 |
Additions | 14.1 | 9.0 | 33.6 | 56.7 |
Disposals | - | - | - | - |
Reclassification at completed cost | 43.4 | - | (43.4) | - |
Revaluations | (2.2) | - | (4.8) | (7.0) |
Fair value re-measurement of investment properties lease liabilities | - | (5.1) | - | (5.1) |
Exchange movements | (17.6) | (0.4) | (0.4) | (18.4) |
At 30 April 2026 | 3,283.6 | 115.0 | 107.8 | 3,506.4 |
| Investment properties, net of lease liabilities £'m | Investment properties lease liabilities £'m | Investment property under construction £'m | Total investment properties £'m |
At 1 November 2024 | 3,052.8 | 100.6 | 130.7 | 3,284.1 |
Additions | 13.1 | 9.0 | 45.8 | 67.9 |
Disposals | - | (1.9) | - | (1.9) |
Reclassifications | 77.7 | - | (77.7) | - |
Revaluations | 21.1 | - | 33.5 | 54.6 |
Fair value re-measurement of lease liabilities | - | (5.1) | - | (5.1) |
Exchange movements | 12.4 | 0.3 | 0.7 | 13.4 |
At 30 April 2025 | 3,177.1 | 102.9 | 133.0 | 3,413.0 |
| H1 2026 (unaudited) £'m | H1 2025 (unaudited) £'m |
Revaluations of investment property and investment property under construction | (7.0) | 54.6 |
Fair value re-measurement of investment properties lease liabilities | (5.1) | (5.1) |
(Loss)/gain on revaluation of investment properties | (12.1) | 49.5 |
The loss on investment properties of £12.1 million (30 April 2025: gain of £49.5 million) as disclosed in the consolidated income statement comprises a £7.0 million revaluation loss on investment properties (30 April 2025: £54.6 million gain), net of lease liabilities and investment properties under construction less the fair value re-measurement of lease liabilities add-back of £5.1 million (30 April 2025: £5.1 million).
The Group has classified investment property and investment property under construction, held at fair value, within Level 3 of the fair value hierarchy. There were no transfers to or from Level 3 during the period. The fair valuation exercise undertaken at 30 April 2026 is explained in note 14.
The fair value of investment property held by the Group classified as the add-back of lease liabilities of £115.0 million (30 April 2025: £102.9 million) reflects expected cash flows (including rent reviews settled that are expected to become payable). Accordingly, if a valuation obtained for a property is net of all payments expected to be made, it will be necessary to add-back any recognised lease liability, to arrive at the carrying amount of the investment property using the fair value model under IAS 40. The lease liability of £115.4 million (30 April 2025: £103.0 million) differs by £0.4 million (30 April 2025: £0.1 million) which relates to the right-of-use asset classified as part of property, plant and equipment.
14. Valuations
External valuation
A sample of the Group's largest properties, representing 33% of the value of the Group's investment property portfolio at 31 October 2025, has been valued by the Group's external valuers, C&W, as at 30 April 2026. The valuation has been carried out in accordance with the requirements of the RICS Valuation - Global Standards which incorporate the International Valuation Standards ("IVS") and the RICS Valuation UK National Supplement (the "RICS Red Book") edition current at 30 April 2026. The valuation of each of the investment properties has been prepared on the basis of fair value as a fully equipped operational entity, having regard to trading potential. The valuation has been provided for accounts purposes and, as such, is a Regulated Purpose Valuation as defined in the Red Book. In compliance with the disclosure requirements of the Red Book, C&W has confirmed that:
· the member of the RICS who has been the signatory to the valuations provided to the Group for the same purposes as previous valuations, has done so since April 2020;
· C&W has been carrying out regular valuations for the same purpose as this valuation on behalf of the Group since October 2006;
· C&W does not provide other significant professional or agency services to the Group;
· The proportion of fees payable by the Group to C&W to the total fee income of C&W's last financial year to 31 December 2025, was less than 5%. We anticipate that the proportion of fees for the financial year to 31 December 2026 will remain at less than 5%; and
· the fee payable to C&W is a fixed amount per property and is not contingent on the appraised value.
Further details of the valuation carried out by C&W as at 31 October 2025, including the valuation method and assumptions, are set out in note 13 to the Group's annual report and financial statements for the year ended 31 October 2025. This note should be read in conjunction with note 13 of the Group's annual report.
Directors' valuation
In addition, at the same date, the Directors have prepared estimates of fair values for the remaining 67% of the Group's investment property portfolio, incorporating assumptions for estimated absorption, revenue growth and capitalisation rates to reflect current market conditions and trading.
Assumptions
The key assumptions incorporated into both the external valuation and the Directors' valuation, calculated on an average basis across the entire portfolio, are:
• Net operating income is based on projected revenue received less projected operating costs together with a central administration charge of 6% of the estimated annual revenue, subject to a cap and collar. The initial net operating income is calculated by estimating the net operating income in the first twelve months following the valuation date.
• The net operating income in future years is calculated assuming either straight-line absorption from day one actual occupancy or variable absorption over years one to four of the cash flow period, to an estimated stabilised/mature occupancy level. In the valuation the assumed stabilised occupancy level for the trading stores (both freeholds and all leaseholds) open at 30 April 2026 averages 88.0% (FY 2025: 89.0%). The projected revenues and costs have been adjusted for estimated cost inflation and revenue growth. The average time assumed for stores to trade at their maturity levels is 18.5 months (FY 2025: 15.7 months).
• The capitalisation rates applied to existing and future net cash flows have been estimated by reference to underlying yields for industrial and retail warehouse property, yields for other trading property types such as purpose-built student housing and hotels, bank base rates, ten-year money rates, inflation, and the available evidence of transactions in the sector. The valuation included in the accounts assumes rental growth in future periods.
• The average freehold exit yield on UK freeholds is 5.37% (FY 2025: 5.36%), on France freeholds is 5.27% (FY 2025: 5.20%), on Spain freeholds is 5.70% (FY 2025: 5.72%), on the Netherlands freeholds is 5.09% (FY 2025: 5.13%), and on Belgium freeholds is 4.83% (FY 2025: 4.90%). The average freehold exit yield for all freeholds adopted is 5.33% (FY 2025: 5.32%).
• The future net cash flow projections (including revenue growth and cost inflation) have been discounted at a rate that reflects the risk associated with each asset. The average annual discount rate adopted (for both freeholds and leaseholds) in the UK portfolio is 9.19% (FY 2025: 9.19%), in the France portfolio is 8.79% (FY 2025: 8.75%), in the Spain portfolio is 8.80% (FY 2025: 8.80%), in the Netherlands portfolio is 8.54% (FY 2025: 8.55%), and in the Belgium portfolio is 8.34% (FY 2025: 8.41%). The average annual discount rate adopted (for both freeholds and all leaseholds) is 9.02% (FY 2025: 9.02%).
• The Group's investment property assets have been valued for the purposes of the financial statements after adjusting for notional purchaser's costs of approximately 6.64% (UK), 8.00% (Paris), 3.93% (Spain), 11.40% (the Netherlands), and 13.00% (Belgium) if they were sold directly as property assets. Sales plus purchaser's costs totalling approximately 7.89% (UK), 9.25% (Paris), 5.18% (Spain), 12.65% (the Netherlands), and 14.25% (Belgium) are assumed on the notional sales in the tenth year in relation to freehold and long leasehold stores. The valuation is an asset valuation which is strongly linked to the operating performance of the business. They would have to be sold with the benefit of operational contracts, employment contracts and customer contracts, which would be difficult to achieve except in a corporate structure. This approach follows the logic of the valuation methodology in that the valuation is based on a capitalisation of the net operating income after allowing a deduction for operational cost and an allowance for central administration costs. A sale in a corporate structure would result in a reduction in the assumed stamp duty land tax but an increase in other transaction costs reflecting additional due diligence resulting in a reduced notional purchaser's cost of c.2.0% of gross value. All significant sized transactions that have been concluded in the UK in recent years were completed in a corporate structure.
All other factors being equal, higher net operating income would lead to an increase in the valuation of a store and an increase in the capitalisation rate or discount rate would result in a lower valuation, and vice versa. Higher assumptions for stabilised occupancy, absorption rate, rental rate and other revenue, and a lower assumption for operating costs, would result in an increase in projected net operating income, and thus an increase in valuation.
As a result of these exercises, as at 30 April 2026, the Group's investment property portfolio has been valued at £3,506.4 million (30 April 2025: £3,413.0 million), and a revaluation loss of £12.1 million (30 April 2025: gain of £49.5 million) has been recognised in the income statement for the period.
A full external valuation of the Group's investment property portfolio will be performed at 31 October 2026.
15. Net assets per share
EPRA's Best Practices Recommendations guidelines for Net Asset Value ("NAV") metrics are EPRA Net Tangible Assets ("NTA"), EPRA Net Reinstatement Value ("NRV") and EPRA Net Disposal Value ("NDV"). EPRA NTA is considered to be the most relevant measure for the Group's business which provides sustainable long term progressive returns and is the primary measure of net assets. EPRA NTA assumes that entities buy and sell assets, thereby crystallising certain levels of unavoidable deferred tax. Due to the Group's REIT status, deferred tax is only provided at each balance sheet date on properties outside the REIT regime. As a result, deferred taxes are excluded from EPRA NTA for properties within the REIT regime. For properties outside of the REIT regime, deferred tax is included to the extent that it is expected to crystallise, based on the Group's track record and tax structuring.
The basic and diluted net assets per share have been calculated based on the following number of shares:
| As at 30 April 2026 Number (unaudited) | As at 30 April 2025 Number (unaudited) | As at 31 October 2025 Number (audited) |
Shares in issue | |||
At year end | 218,490,500 | 218,490,500 | 218,490,500 |
Adjustment for Employee Benefit Trust (treasury) shares | (52,933) |
(70,531) | (70,531) |
IFRS/EPRA number of shares (basic) | 218,437,567 | 218,419,969 | 218,419,969 |
Dilutive effect of Save As You Earn shares | 19,889 | 155,022 | 84,752 |
Dilutive effect of Long Term Incentive Plan shares | 1,403,237 | 1,124,919 | 1,194,321 |
IFRS/EPRA number of shares (diluted) | 219,860,693 | 219,699,910 | 219,699,042 |
EPRA NTA is shown in the table below:
As at 30 April 2026 (unaudited) | Net assets £'m | Basic net assets per share pence | Diluted net assets per share pence |
Statutory net asset value | 2,273.6 | 1,041 | 1,034 |
Adjustments to exclude: | |||
Fair value of derivative | (1.6) | ||
Deferred tax liabilities on the revaluation of investment properties | 175.2 |
|
|
EPRA net asset value | 2,447.2 | 1,120 | 1,113 |
As at 30 April 2025 (unaudited) | Net assets £'m | Basic net assets per share pence | Diluted net assets per share pence |
Statutory net asset value | 2,266.4 | 1,038 | 1,032 |
Adjustments to exclude: | |||
Deferred tax liabilities on the revaluation of investment properties | 173.0 |
|
|
EPRA net asset value | 2,439.4 | 1,117 | 1,110 |
As at 31 October 2025 (audited) | Net assets £'m | Basic net assets per share pence | Diluted net assets per share pence |
Statutory net asset value | 2,288.4 | 1,048 | 1,042 |
Adjustments to exclude: | |||
Deferred tax liabilities on the revaluation of investment properties | 176.7 |
|
|
EPRA net asset value | 2,465.1 | 1,129 | 1,122 |
Basic net assets per share is shareholders' funds divided by the number of shares at the year end. Diluted net assets per share is shareholders' funds divided by the number of shares at the year end, adjusted for dilutive share options of 1,423,126 shares (H1 2025: 1,279,941 shares, FY 2025: 1,279,073). EPRA diluted net assets per share excludes deferred tax liabilities arising on the revaluation of investment properties. The EPRA NAV, which further excludes fair value adjustments for debt and related derivatives net of deferred tax, was £2,447.2 million (H1 2025: £2,439.4 million, FY 2025 £2,465.1 million), giving diluted EPRA NTA per share of 1,113 pence (H1 2025: 1,110 pence, FY 2025: 1,122 pence). The Directors consider that these alternative measures provide useful information on the performance of the Group.
EPRA adjusted balance sheet (non-statutory)
| As at 30 April 2026 (unaudited) £'m | As at 30 April 2025 (unaudited) £'m | As at 31 October 2025 (audited) £'m |
Assets | |||
Non-current assets | 3,575.8 | 3,469.5 | 3,547.0 |
Current assets | 43.3 | 52.2 | 44.0 |
Total assets | 3,619.1 | 3,521.7 | 3,591.0 |
Liabilities |
| ||
Current liabilities | (164.9) | (67.2) | (165.9) |
Non-current liabilities | (1,007.0) | (1,015.1) | (960.0) |
Total liabilities | (1,171.9) | (1,082.3) | (1,125.9) |
EPRA adjusted Net Asset Value | 2,447.2 | 2,439.4 | 2,465.1 |
EPRA adjusted Basic net assets per share | 1,120 pence | 1,117 pence | 1,129 pence |
16 Borrowings
As at30 April2026 | As at30 April2025 | As at31 October 2025 | |
(unaudited) | (unaudited) | (audited) | |
£'m | £'m | £'m | |
USPP Notes | 541.6 | 536.1 | 546.9 |
RCF - drawn | 395.4 | 392.8 | 347.8 |
Term loan | 67.0 | - | 68.2 |
Debt issue costs | (4.0) | (4.5) | (4.7) |
1,000.0 | 924.4 | 958.2 |
As at 30 April 2026 the Group has US Private Placement Notes ("USPPs") of €377.1 million (H1 2025: €377.1 million) which have maturities between 2026 and 2033 with fixed-rate coupons of between 0.93% and 4.03% and £215.5 million (H1 2025: £215.5 million) which have maturities between 2026 and 2031 with fixed-rate coupons of between 1.96% and 2.92%. The weighted average cost of interest on the overall USPPs at 30 April 2026 was 2.36% per annum.
In June 2025 the Group entered into a new Euro-denominated Term loan facility agreement for €77.5 million which has a maturity date of 30 June 2030. The interest on this loan has a fixed margin of between 1.25% and 1.45%, by reference to the Group's performance against its covenants, and a variable rate based on the three-month EURIBOR rate at the start of each quarter. At the same time, a matching interest rate swap was entered into with the same maturity date with the effect of fixing the interest rate of the Term loan with the relationship being designated as a cash flow hedge.
In addition the Group has arranged a Revolving Credit Facility ("RCF") with its relationship banks. The RCF attracts a margin over SONIA/EURIBOR of between 1.25% and 1.45%, by reference to the Group's performance against its covenants. A further 0.05% discount is available to the Group on the margin for both the RCF and the Term Loan if certain Environmental, Social and Governance (ESG) conditions are met.
The €658.6 million of Euro denominated borrowings provides a natural hedge against the Group's investment in the Paris and Expansion Markets businesses, so the Group has applied net investment hedge accounting and the retranslation of these borrowings is recognised directly in the translation reserve.
Borrowings are stated after unamortised issue costs of £4.0 million (H1 2025: £4.5 million).
Borrowings are repayable as follows:
As at30 April2026 | As at30 April2025 | As at 31 October2025 | |
| (unaudited) | (unaudited) | (audited) |
| £'m | £'m | £'m |
Within one year | 95.5 | - | 96.5 |
Between one and two years | 64.1 | 94.5 | 65.1 |
Between two and five years | 678.8 | 670.3 | 634.3 |
After more than five years | 165.6 | 164.1 | 167.0 |
Borrowings | 1,004.0 | 928.9 | 962.9 |
Unamortised issue costs | (4.0) | (4.5) | (4.7) |
1,000.0 | 924.4 | 958.2 |
The effective interest rates at the balance sheet date were as follows:
As at30 April2026 | As at30 April2025 | As at31 October2025 | |
(unaudited) | (unaudited) | (audited) | |
USPP Notes - GBP | 2.55% | 2.55% | 2.55% |
USPP Notes - EUR | 2.24% | 2.24% | 2.24% |
RCF - GBP | Monthly, quarterly or six-monthly SONIA plus 1.25% | Monthly, quarterly or six-monthly SONIA plus 1.25% | Monthly, quarterly or six-monthly SONIA plus 1.25% |
RCF - EUR | Monthly, quarterly or six monthly EURIBOR plus 1.25% | Monthly, quarterly or six monthly EURIBOR plus 1.25% | Monthly, quarterly or six monthly EURIBOR plus 1.25% |
Term loan - EUR | Three-month EURIBOR plus 1.25% | - | Three-month EURIBOR plus 1.25% |
In addition to the margin of 1.25%, the RCF and Term loan also had ESG targets enabling a reduction in the margin of up to 5bps to 1.20%. In the period these targets were all met.
The carrying amounts of the Group's borrowings are denominated in the following currencies:
As at30 April2026 | As at30 April2025 | As at 31 October2025 | |
| (unaudited) | (unaudited) | (audited) |
| £'m | £'m | £'m |
Sterling | 434.5 | 374.5 | 387.5 |
Euros | 569.5 | 554.4 | 575.4 |
1,004.0 | 928.9 | 962.9 |
The Group has the following undrawn committed borrowing facilities available at 30 April 2026 in respect of which all conditions precedent had been met at that date:
Floating rate | |||
As at30 April2026 | As at30 April2025 | As at31 October2025 | |
(unaudited) | (unaudited) | (audited) | |
| £'m | £'m | £'m |
Expiring beyond one year | 104.6 | 107.2 | 152.2 |
17. Called up share capital
As at30 April2026 | As at30 April2025 | As at31 October2025 | |
| (unaudited) | (unaudited) | (audited) |
Called up, issued and fully paid | £'m | £'m | £'m |
2218,490,500 (30 April 2025: 218,490,500) ordinary shares of 1p each | 2.2 | 2.2 | 2.2 |
18. Provisions
In France, the basis on which property taxes have been assessed has been challenged by the tax authority for financial years 2011 onwards. In November 2022, the French Supreme Court delivered a final judgement in respect of litigation for years 2011 to 2013, which resulted in a partial success for the Group. The Group is separately pursuing litigation in respect of years since 2013 and has lodged an appeal with the French administrative tribunal against the issues included in assessments for 2013 onwards on which it was ultimately unsuccessful in the French Supreme Court for the earlier years. A provision is included in the consolidated financial accounts of £2.3 million at 30 April 2026 (31 October 2025: £2.3 million) to reflect the uncertainty surrounding the likelihood of a successful outcome. Of the total provided, £nil has been released in relation to the half year ended 30 April 2026 within cost of sales (Underlying EBITDAR) (30 April 2025: £nil). The litigation is expected to be resolved over the next few years.
It is possible that the French tax authority may appeal the decisions of the French Court of Appeal in which the Group was successful to the French Supreme Court. The maximum potential exposure in relation to these issues at 30 April 2026 is £0.8 million (31 October 2025: £0.8 million). No provision for any further potential exposure has been recorded in the consolidated financial statements since the Group believes it is more likely than not that a successful outcome will be achieved, resulting in no additional liabilities.
19. Contingent liabilities
The Group has a contingent liability in respect of property taxation in the French subsidiary as disclosed in note 18.
20. Capital commitments
The Group had £45.0 million of capital commitments as at 30 April 2026 (31 October 2025: £50.0 million).
21. Related party transactions
The Group's shares are widely held. Transactions between the Company and its subsidiaries, which are related parties, have been eliminated on consolidation and are not disclosed in this note.
Transactions with PBC Les Groues SAS
As described in note 11, the Group has a 24.9% interest in PBC Les Groues SAS ("PBC"). During the period, the Group made no transactions with PBC (H1 2025: £nil). The total amount invested by the Group is included in its non-current investments in associates. The balance outstanding at 30 April 2026 included within trade and other receivables was £nil (FY 2025: £nil).
Transactions with CERF II German Storage Topco S.a.r.l ("CERF II")
As described in note 11, the Group has a 10.0% interest in CERF II German Storage Topco S.a.r.l ("CERF II"). The total amount invested by the Group is included in its non-current investments in associates. During the period, the Group recharged £0.7 million (H1 2025: £0.2 million) relating to management and development services and earned £0.1 million (H1 2025: £0.2 million) in interest income. The balance outstanding at 30 April 2026 was £0.4 million (FY 2025: £0.3 million).
Transactions with EasyBox
As described in note 12, the Group has a 50.0% interest in the EasyBox joint venture. The total amount invested by the Group is included in its non-current investments in joint ventures. Safestore Italia S.R.L. (a wholly owned subsidiary of the Group) acts as property manager for the joint venture. In its capacity as property manager, it incurs costs on behalf of the joint venture which are recharged in accordance with the property management agreement. The balance of these recharges outstanding at 30 April 2026 was £0.5 million (H1 2025: £0.1 million). During the period, Safestore Italia S.R.L also received a management fee from the joint venture of £0.5 million (H1 2025: £0.3 million). The balance outstanding in relation to management fees at 30 April 2026 was £nil (FY 2025: £nil).
22. Post-balance sheet events
The Group has arranged a new USPP loan note to be drawn in October 2026, for a total of €150.0 million expiring in May 2032 with an all-in coupon of 4.10%.
Risk management
The delivery of our strategic objectives is dependent on effective risk management. There are a number of potential risks and uncertainties which could have a material impact on the Group's performance and could cause actual results to differ materially from expected and historical results. Details of the principal risks facing the Group were included on pages 38 to 42 of the Annual Report and Financial Statements for the year ended 31 October 2025, a copy of which is available at www.safestore.com, and include:
· Strategic risks
· Finance risk
· Treasury risk
· Property investment and development risk
· Valuation risk
· Occupancy risk
· Operational risk
· Regulatory compliance risk
· Marketing risk
· IT security/GDPR
· Brand and Reputational risk
· Geographical expansion
· Human resource risk
· Climate change related risk
The Company regularly assesses these risks together with the associated mitigating factors listed in the 2025 Annual Report. The levels of activity in the Group's markets and the level of financial liquidity and flexibility continue to be the areas designated as appropriate for added management focus.
We continue to believe that our market leading position in the UK and Paris, our strong brand and depth of management, as well as our retail expertise and infrastructure, help mitigate the effects of fluctuations in the economy or the housing market. Furthermore, the UK self-storage market remains immature with little risk of supply outstripping demand in the medium term. Our prudent approach on new stores reduces our dependence on the number of non-trading investment properties in relation to the established and mature stores that provide relatively stable and growing cash flow. The Board regularly reviews the cash requirements of the business, including the covenant position although given the nature of the product, customer base and lack of working capital requirements, liquidity is not considered to be a significant risk. The Outlook section of this half yearly report provides a commentary concerning the remainder of the financial year. Statement of Directors' responsibilities for the half year ended 30 April 2026
The Directors confirm that, to the best of their knowledge, this condensed consolidated interim financial information has been prepared in accordance with IAS 34 as contained in the United Kingdom adopted IFRS and that the interim management report includes a fair review of the information required by DTR 4.2.4R, DTR 4.2.7R and DTR 4.2.8R, namely:
· the condensed set of financial statements gives a true and fair view of the assets, liabilities, financial position and profit or loss of Safestore Holdings plc, or the undertakings included in the consolidation;
· an indication of important events that have occurred during the first six months of the financial year and their impact on the condensed set of financial statements, and a description of the principal risks and uncertainties for the remaining six months of the financial year; and
· material related-party transactions in the first six months and any material changes in the related-party transactions described in the last annual report.
A list of current Directors is maintained on the Safestore Holdings plc website, www.safestore.com.
The Directors are responsible for the maintenance and integrity of the Company's website. Legislation in the United Kingdom governing the preparation and dissemination of financial statements may differ from legislation in other jurisdictions.
By order of the Board
Frederic Vecchioli | Simon Clinton |
10 June 2026 | 10 June 2026 |
Chief Executive Officer
| Chief Financial Officer
|
INDEPENDENT REVIEW REPORT TO SAFESTORE HOLDINGS PLC
Conclusion
We have been engaged by the company to review the condensed set of financial statements in the half-yearly financial report for the six months ended 30 April 2026 which comprises the consolidated income statement, the consolidated balance sheet, the consolidated statement of changes in equity, the consolidated cash flow statement and related notes 1 to 22.
Based on our review, nothing has come to our attention that causes us to believe that the condensed set of financial statements in the half-yearly financial report for the six months ended 30 April 2026 is not prepared, in all material respects, in accordance with the accounting policies the group intends to use in preparing its next annual financial statements and the Disclosure Guidance and Transparency Rules of the United Kingdom's Financial Conduct Authority.
Basis for Conclusion
We conducted our review in accordance with International Standard on Review Engagements (UK) 2410 "Review of Interim Financial Information Performed by the Independent Auditor of the Entity" issued by the Financial Reporting Council for use in the United Kingdom (ISRE (UK) 2410). A review of interim financial information consists of making inquiries, primarily of persons responsible for financial and accounting matters, and applying analytical and other review procedures. A review is substantially less in scope than an audit conducted in accordance with International Standards on Auditing (UK) and consequently does not enable us to obtain assurance that we would become aware of all significant matters that might be identified in an audit. Accordingly, we do not express an audit opinion.
As disclosed in note 2, the annual financial statements of the group are prepared in accordance with United Kingdom adopted international accounting standards. The condensed set of financial statements included in this half-yearly financial report has been prepared in accordance with United Kingdom adopted International Accounting Standard 34, "Interim Financial Reporting".
Conclusion Relating to Going Concern
Based on our review procedures, which are less extensive than those performed in an audit as described in the Basis for Conclusion section of this report, nothing has come to our attention to suggest that the directors have inappropriately adopted the going concern basis of accounting or that the directors have identified material uncertainties relating to going concern that are not appropriately disclosed.
This Conclusion is based on the review procedures performed in accordance with ISRE (UK) 2410; however future events or conditions may cause the entity to cease to continue as a going concern.
Responsibilities of the directors
The directors are responsible for preparing the half-yearly financial report in accordance with the Disclosure Guidance and Transparency Rules of the United Kingdom's Financial Conduct Authority.
In preparing the half-yearly financial report, the directors are responsible for assessing the group's ability to continue as a going concern, disclosing as applicable, matters related to going concern and using the going concern basis of accounting unless the directors either intend to liquidate the company or to cease operations, or have no realistic alternative but to do so.
Auditor's Responsibilities for the review of the financial information
In reviewing the half-yearly financial report, we are responsible for expressing to the company a conclusion on the condensed set of financial statements in the half-yearly financial report. Our Conclusion, including our Conclusion Relating to Going Concern, are based on procedures that are less extensive than audit procedures, as described in the Basis for Conclusion paragraph of this report.
Use of our report
This report is made solely to the company in accordance with ISRE (UK) 2410. Our work has been undertaken so that we might state to the company those matters we are required to state to it in an independent review report and for no other purpose. To the fullest extent permitted by law, we do not accept or assume responsibility to anyone other than the company, for our review work, for this report, or for the conclusions we have formed.
Deloitte LLP
Statutory Auditor
London, United Kingdom
10 June 2026