Today 07:00

ZAMBEEF PRODUCTS PLC
Incorporated in the Republic of Zambia
Company registration number: 31824
Share Code: ZAMBEEF
ISIN: ZM0000000201
Interim results for the half-year ended 31 March 2026
Zambeef (AIM: ZAM), the fully integrated cold chain food products ("CCFP") and retail business with operations in Zambia, Nigeria and Ghana, today announces its results for the half-year ended 31 March 2026.
Financial Highlights
Figures in 000's |
| 2026 | 2025 | % |
| 2026 | 2025 | % |
|
| ZMW | ZMW |
| USD | USD | ||
Revenue |
| 3,930,788 | 3,840,668 | 2.3% | 180,477 | 139,661 | 29.2% | |
Change in fair value of biological assets | 722,852 | 876,122 | -17.5% | 33,189 | 31,859 | 4.2% | ||
Cost of sales |
| (3,143,576) | (3,308,655) | -5.0% | (144,333) | (120,315) | 20.0% | |
Gross profit | 1,510,064 | 1,408,135 | 7.2% | 69,333 | 51,205 | 35.4% | ||
Administrative expenses |
| (1,049,175) | (976,336) | 7.5% | (48,171) | (35,503) | 35.6% | |
Distribution Expenses |
| (189,578) | (155,168) | 22.2% | (8,704) | (5,642) | 54.3% | |
Net impairment losses on financial assets |
| (6,211) | (2,136) | 190.7% | (285) | (78) | 265.4% | |
Other income/(expenses) |
| 57,553 | (26,751) | - | 2,642 | (973) | - | |
Operating profit |
| 322,653 | 247,744 | 30.2% | 14,815 | 9,009 | 64.4% | |
Finance Income | - | 5,333 | -100.0% | - | 244 | -100.0% | ||
Finance costs |
| (239,817) | (200,638) | 19.5% | -11,011 | -7,102 | 54.9% | |
Profit before taxation |
| 82,836 | 52,439 | 58.0% | 3,804 | 1,907 | 99.2% | |
Taxation charge |
| (10,986) | (17,943) | -38.8% | (504) | (652) | -22.7% | |
Group income for the period | 71,850 | 34,496 | 108.3% | 3,300 | 1,255 | 162.6% | ||
|
|
|
|
|
|
|
|
Financial Performance
The Group delivered a resilient performance for the six months ended 31 March 2026, navigating an operating landscape characterised by a markedly stronger Kwacha, easing inflation, and dramatically improved energy availability. Through effective revenue management and operational efficiency, the business delivered growth in earnings across the period, demonstrating the adaptability and continued momentum of our integrated business model.
The Group achieved a revenue of ZMW 3.9 billion (USD 180.5 million), along with a gross profit of ZMW 1.5 billion (USD 69.3 million) for the six-month period. Revenue grew by 2.3% year-on-year in Kwacha terms. The material appreciation of the Kwacha - which strengthened by approximately 19% against the US Dollar during the period - resulted in a significantly higher figure in US Dollar terms, with revenue up 29.2% and gross profit up 35.4% in USD year-on-year. Gross profit growth of 7.2% in Kwacha terms reflects improved margins across several divisions, driven principally by the favourable impact of currency appreciation on import-denominated input costs, particularly in the Stockfeed division.
Furthermore, the Group delivered an operating profit of ZMW 322.7 million (USD 14.8 million), marking an increase of 30.2% in Kwacha terms and 64.4% in US Dollar terms compared to the prior half-year of ZMW 247.7 million (USD 9.0 million). This growth underscores the effectiveness of our commercial strategy and the continued contribution of our commissioned strategic expansion projects.
The Group is committed to strengthening its brand equity while consistently delivering high-quality products to our customers. By leveraging our diversified and vertically integrated business model, along with a portfolio of well-established brands and a capable management team, we are strategically positioned to take advantage of emerging growth opportunities and effectively manage potential risks. This strong foundation enables us to respond with resilience and agility in a shifting market landscape.
Outlook
Looking ahead to the second half of the financial year, the completion of the summer crop harvest in June is expected to materially improve the Cropping division's contribution and provide a favourable internal raw material base for Stockfeed and Milling. Our vertically integrated business model offers a significant competitive advantage, ensuring a reliable supply chain and a consistent market for our products across each link of the value chain.
Zambia's economy is showing encouraging signs of continued recovery, with GDP growth projected at approximately 4.4% for the full year, underpinned by expansion in copper production and a strong agricultural season. Continued moderation in inflation, supported by the Bank of Zambia's monetary policy stance, is expected to sustain consumer purchasing power recovery and support demand across our key product categories. These positive macroeconomic developments create a more favourable operating environment for Zambeef in the second half.
We will continue to strengthen our balance sheet by pursuing the divestiture of non-core assets, optimising our existing resources, and making targeted capacity investments aligned with our strategic growth priorities. Following the period end, the completion of the BII preference share conversion has materially simplified our capital structure, positioning the Group more strongly for the period ahead. With a solid operational foundation and a clear strategic direction, Zambeef is well-positioned for continued growth in the second half of the year and beyond.
The interim report for the six-month period ended 31 March 2026 will shortly be available on the Company's website: www.zambeefplc.com/half-year-results/
For further information, please visit www.zambeefplc.com or contact:
Zambeef Products plc | Tel: +260 (0) 211 369003 |
Faith Mukutu, Chief Executive Officer | |
Patrick Kalifungwa, Chief Financial Officer | |
Cavendish Capital Markets Limited (Nominated Adviser and Broker) | Tel: +44 (0) 20 7220 0500 |
Ed Frisby/Isaac Hooper | |
Autus Securities Limited (Sponsoring Broker) | Tel: +260 (0) 211 840 513 |
Mataka Nkhoma | |
By order of the Board Mwansa Mutimushi Company Secretary Issued in Lusaka, Zambia on 25 June 2026 |
Notes to Editors
Zambeef Products plc is the largest integrated cold chain food products and agribusiness company in Zambia and one of the largest in the region, involved in the primary production, processing, distribution and retailing of beef, chicken, pork, milk, dairy products, fish, flour and stockfeed, throughout Zambia and the surrounding region, as well as Nigeria and Ghana.
It has 241 retail outlets throughout Zambia and West Africa.
The Company is one of the largest suppliers of beef in Zambia. Five beef abattoirs and three feedlots are located throughout Zambia, with a capacity to slaughter 234,000 cattle a year. It is also one of the largest chicken producers in Zambia, with a capacity of 12.5m broilers and 31 million-day-old chicks a year. It has one of the pig abattoirs and pork processing plants in Zambia, with a capacity to slaughter 102,000 pigs a year, while its dairy processing has a capacity of 140,000 litres per day.
The Group is also one of the largest cereal row cropping operations in Zambia, with approximately 7,256 hectares of row crops under irrigation, which are planted twice a year, and a further 7,941 hectares of rainfed/dry-land crops available for planting each year.
CHAIRMAN'S REVIEW
Dear Shareholder,
This report sets out the Group's performance during the first half of the 2026 fiscal year, highlights the dynamic environment in which we continue to operate, and reaffirms the Board's commitment to building resilience and delivering long-term value for Zambeef's shareholders.
During the six months ended 31 March 2026, the Group operated in a markedly improved macroeconomic environment compared with the prior year. Headline inflation moderated materially and the Bank of Zambia reduced the Monetary Policy Rate, which together began to restore consumer purchasing power and ease local-currency financing costs. These developments, alongside a stronger Kwacha, provided a more supportive backdrop for demand and reduced the Kwacha cost of certain dollar-denominated inputs and obligations.
Management remained focused on the Group's strategic priorities of maximising revenue, driving volume growth and optimising costs. Through disciplined execution and targeted operational interventions, the Group delivered a resilient financial performance for the period. Operating profit of ZMW 322.7 million (USD 14.8 million) for the six months ended 31 March 2026 represents a 30.2% year-on-year increase, reflecting the enduring strength of our vertically integrated model and the effectiveness of the actions taken to protect margins and cash flow during a period of economic transition.
Strategy
The Board remains steadfast in its commitment to achieving the Group's strategic objectives, undeterred by seasonal market dynamics and economic fluctuations. Our five-year strategy is centred on the following key pillars:
1. Strengthening our core business: We remain committed to reinforcing our core operations through strategic investments that expand our market share and solidify our presence in key sectors. Our focus is on broadening our market reach and diversifying our product portfolio to capture emerging opportunities and drive sustainable growth.
2. Human Capital Development: Our focused human capital strategy is designed to ensure that our workforce is well-equipped and empowered to drive the Group's success. By prioritizing skills development aligned with our strategic objectives, we continue to cultivate a motivated and capable team that underpins sustainable growth and operational excellence.
3. Enhancing Strategic Partnerships: Strategic partnerships play a vital role in enhancing our competitive edge and market position. We are committed to strengthening these partnerships to capitalise on synergies and opportunities for growth. Our commitment to our customers, suppliers, lenders and other partners remains resolute.
4. Divestiture of Non-Core Assets: Linked to the pillar to focus on our core business and our pursuit to optimise resource allocation, we are actively pursuing divestiture of non-core assets.
Progress on the USD 100 million expansion programme has been steady, with completed projects delivering tangible returns. The Mpongwe row-cropping expansion continues to yield strong harvests, with the current summer crop due for completion in June; the milling and hatchery facilities are fully operational; and the cheese plant, commissioned in April 2025, is scaling production as the Group expands its market share. Collectively, these milestones are strengthening internal supply security, advancing import substitution and enhancing the Group's capacity to meet growing market demand.
Outlook
Looking ahead, favourable rainfall patterns and a strong cropping season supported by improved irrigation performance at Mpongwe and good growing conditions across our summer plantings-are expected to deliver a materially improved national maize and soya crop. This should help stabilise grain prices, reduce input cost volatility and strengthen feed and milling margins in the second half of the year, supporting our processing units and improving working-capital dynamics. We will, nonetheless, remain vigilant in managing our exposure to fuel and fertiliser price movements, which continue to be shaped by ongoing geopolitical conflict and the resulting disruption to global energy and agricultural input markets. Contingency plans remain in place to protect margins and ensure supply continuity in the event of further price escalation or supply-chain disruption.
British International Investment Plc (BII)
I am pleased to inform you that a significant capital-structure development was completed following the period end. Following shareholder approval at the Extraordinary General Meeting on 11 March 2026, British International Investment Plc (BII) exercised its conversion rights and converted 100,057,658 convertible redeemable preference shares into 308,511,112 ordinary shares, effective 29 April 2026. The conversion increased the Group's issued ordinary share capital to 609,090,742 ordinary shares, resulting in a materially simplified balance sheet. The Board regards this outcome as a positive development for the Company: it aligns shareholder interests and strengthens the Group's capacity to pursue its strategic priorities over the long term.
Acknowledgement
I wish to express my sincere gratitude to my fellow Board members for their strategic oversight, and I commend our management and staff for the dedication and professionalism that defined this successful half-year. The agility demonstrated in transitioning from defensive measures to a posture of growth-oriented efficiency is a clear testament to the talent and resilience of the Zambeef team.
As we look toward the remainder of the year, we remain resolute in our commitment to harnessing Zambia's improving economic conditions to drive sustainable value for our shareholders and all stakeholders.
Patrick Wanjelani
Chairman
Chief Executive Officer's Report
Overview
The six months ended 31 March 2026 saw the Group deliver a resilient financial performance against a markedly improved macroeconomic backdrop. This performance underscores our agility and adaptability in navigating a period of significant economic transition. The management team's unwavering commitment to maximising revenue, driving volume growth and optimising costs has been instrumental in delivering a 30.2% year-on-year increase in operating profit during the period.
The operating environment during the period was shaped by a markedly stronger Zambian Kwacha, which appreciated by approximately 19% against the US Dollar during the six months under review, declining headline inflation, and a substantially improved power supply relative to the drought-affected conditions of the prior year. The Bank of Zambia reduced the Monetary Policy Rate from 14.5% to 13.5% during the period, easing local-currency financing costs and beginning to restore consumer purchasing power. These developments reduced energy costs and the Kwacha cost of import-denominated inputs, while also creating some margin headwinds in milling as wheat prices fell below book value with the strengthening currency.
Notwithstanding these dynamics, Zambeef demonstrated its characteristic resilience through disciplined cost management, targeted operational interventions, and the enduring strength of our vertically integrated business model. Our ability to grow operating profit reflects the quality of our asset base, the commitment of our people, and the trust placed in us by our customers, suppliers, and communities.
Operational Excellence
In the period, Zambeef continued to reaffirm its commitment to operational excellence, quality, and compliance through several important achievements across its operations.
Zamshu Factory attained ISO 9001:2015 certification during the period, reflecting the sustained investment in quality systems and process discipline within our leather and footwear operations. This milestone further strengthens the Division's competitive positioning as Government policy continues to support the local footwear industry. Zamshu is well-placed to capitalise on the resulting increase in domestic demand, and the addition of a new domestic leather supply chain in South Africa is expected to further improve quality and reduce production costs from the second half of the financial year.
Separately, structured engagement is underway with Zambia Halaal Certifiers (ZAMHA) to advance Halaal certification across Zambeef's operations. Initial assessments of Huntley and key abattoir sites have been completed, with certification readiness activities progressing ahead of the final audit. Additionally, the International Finance Corporation (IFC) has engaged the Group on a parallel process targeting export market certification for the Middle East, with a focus on UAE and Saudi Arabian markets. Successful attainment of Halaal certification is expected to materially enhance our domestic market reach and unlock meaningful export revenue opportunities.
These initiatives highlight our commitment to continuous improvement and alignment with national and international standards, further establishing Zambeef as a trusted leader in food safety, sustainability, and animal welfare within Zambia's agribusiness sector.
Supporting National Food Security
The Group's summer cropping programme is on track to deliver a materially improved harvest, with approximately 14,700 hectares cultivated across soya beans, grain maize, and silage maize at Mpongwe and Huntley farms. Favourable rainfall during the season has supported strong crop establishment, and the summer harvest is expected to complete in June 2026. This yield will enhance internal raw material supply for our Stockfeed and Milling operations, reduce dependence on third-party procurement, and contribute to national grain availability at a time when the country's food security outlook is improving.
Financial Performance
The Group delivered a resilient performance for the six months ended 31 March 2026, navigating an operating landscape characterised by a markedly stronger Kwacha, easing inflation, and dramatically improved energy availability. Through effective revenue management and operational efficiency, the business delivered growth in earnings across the period, demonstrating the adaptability and continued momentum of our integrated business model.
The Group achieved a revenue of ZMW 3.9 billion (USD 180.5 million), along with a gross profit of ZMW 1.5 billion (USD 69.3 million) for the six-month period. Revenue grew by 2.3% year-on-year in Kwacha terms. The material appreciation of the Kwacha - which strengthened by approximately 19% against the US Dollar during the period - resulted in a significantly higher figure in US Dollar terms, with revenue up 29.2% and gross profit up 35.4% in USD year-on-year. Gross profit growth of 7.2% in Kwacha terms reflects improved margins across several divisions, driven principally by the favourable impact of currency appreciation on import-denominated input costs, particularly in the Stockfeed division.
Furthermore, the Group delivered an operating profit of ZMW 322.7 million (USD 14.8 million), marking an increase of 30.2% in Kwacha terms and 64.4% in US Dollar terms compared to the prior half-year of ZMW 247.7 million (USD 9.0 million). This growth underscores the effectiveness of our commercial strategy and the continued contribution of our commissioned strategic expansion projects.
The Group is committed to strengthening its brand equity while consistently delivering high-quality products to our customers. By leveraging our diversified and vertically integrated business model, along with a portfolio of well-established brands and a capable management team, we are strategically positioned to take advantage of emerging growth opportunities and effectively manage potential risks. This strong foundation enables us to respond with resilience and agility in a shifting market landscape.
Strategic focus
Our strategic priorities remain focused on maximising the use of our existing assets, enhancing returns, and ensuring sustained profitability across our core business segments. Zambeef's integrated model continues to prove its strength, allowing us to achieve efficiencies throughout the value chain while maintaining our leadership in key food categories.
Progress on our USD 100 million expansion programme has been steady during the period, with completed projects delivering tangible returns. Key milestones include: the Mpongwe row-cropping expansion continuing to yield strong harvests; the milling and hatchery facilities operating at full capacity; and the cheese plant, commissioned in April 2025, scaling production and onboarding significant new customers. These investments are strengthening internal supply security, advancing import substitution, and enhancing our capacity to meet growing market demand.
A further milestone achieved in the period was the commissioning of the pasta plant at our Mpongwe milling facility. This facility represents a significant step in the Group's value-addition strategy, producing pasta under the Favourite Foods brand and creating a new revenue stream for the Milling division. Initial sales into leading retail chains are targeted for the second half of the financial year, and the pasta line is expected to make a meaningful contribution to both volumes and margins as it scales.
The Group continues to pursue the divestment of non-core operations and reinvest in high-impact areas that enhance cash generation and improve return on capital employed. This disciplined approach ensures that every investment contributes to efficiency, competitiveness, and shareholder value.
Looking ahead, our strategic focus remains on building a more efficient, profitable, and resilient business that delivers sustainable value for all stakeholders while supporting Zambia's broader agricultural and industrial development.
Divisional Performance
Table 1 (ZMW) and Table 2 (USD) below provide a summary of the consolidated performance of the key business divisions reported at an operating profit level.
Table 1: Divisional financial summary in ZMW'000
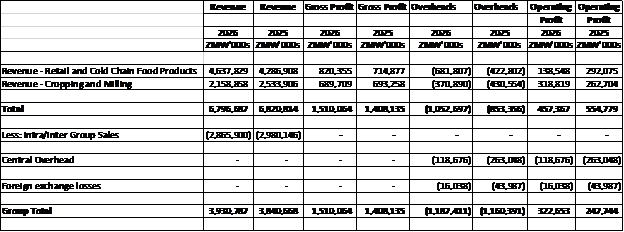
Table 2: Divisional financial summary in USD'000
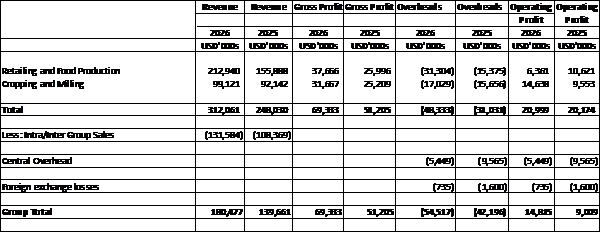
Retailing & Cold Chain Food Products
The Retailing and Cold Chain Food Products division delivered a resilient performance in the first half of the 2026 financial year, sustaining revenues broadly in line with prior year despite supply challenges in beef and chicken arising from constrained cattle availability and poultry service level limitations. Gross profit performance was supported by a favourable product mix, disciplined pricing execution, and significantly reduced energy costs as power supply improved materially compared to the prior year.
The Beef segment navigated a period of constrained livestock supply, as improved grazing conditions following good rains led farmers to retain herds for rebuilding. Despite lower volumes, the division maintained healthy margins through disciplined channel management and strong average pricing, with the export channel delivering exceptional growth during the period.
The Poultry segment delivered a mixed performance. Zamhatch achieved outstanding results for the half year, with day-old chick sales 16.4% above budget and 23.3% above prior year, driven by strong market demand and exceptional flock performance. Zamchick faced volume headwinds from processed chicken stockouts in the early months of the period, though production efficiencies improved significantly year-on-year.
The Dairy segment delivered strong financial performance, supported by high average pricing across Lacto, drinking yoghurt, and cheese, and a favourable product mix. The cheese plant continued to scale with volumes growing strongly year-on-year and significant new accounts successfully onboarded. Volume performance was partially constrained by packaging supply challenges affecting drinking yoghurt. Zammilk continued to strengthen its position as the leader in the fresh milk and Lacto markets.
Cropping and Milling
The summer cropping programme delivered strong results during the period, with approximately 14,700 hectares planted across soya beans, grain maize, and silage maize at Mpongwe and Huntley farms. Favourable rainfall supported excellent crop establishment and yields. Silage maize harvesting was completed in February 2026, while soya beans and grain maize were in active harvest at period end, with full completion expected in June 2026. The Kwacha appreciation during the period created a foreign exchange headwind on biological asset valuations, which partially offset the strong underlying operational performance from the division.
The Stockfeed division delivered an excellent performance during the half year, significantly outperforming on gross profit and operating profit. The primary driver was the impact of Kwacha appreciation on US Dollar-denominated raw material costs, which reduced the cost base substantially, complemented by disciplined procurement at optimal market prices. The division maintained its market leadership position, delivering positive volume growth in the second quarter against a competitive trading environment.
The Milling segment faced a challenging first half, with volumes below budget across all channels due to intense pricing competition and the entry of an additional supplier into the Shoprite bakery segment. Stock revaluation adjustments were required as market wheat prices declined below book value.
Outlook
Looking ahead to the second half of the financial year, the completion of the summer crop harvest in June is expected to materially improve the Cropping division's contribution and provide a favourable internal raw material base for Stockfeed and Milling. Our vertically integrated business model offers a significant competitive advantage, ensuring a reliable supply chain and a consistent market for our products across each link of the value chain.
Zambia's economy is showing encouraging signs of continued recovery, with GDP growth projected at approximately 4.4% for the full year, underpinned by expansion in copper production and a strong agricultural season. Continued moderation in inflation, supported by the Bank of Zambia's monetary policy stance, is expected to sustain consumer purchasing power recovery and support demand across our key product categories. These positive macroeconomic developments create a more favourable operating environment for Zambeef in the second half.
We will continue to strengthen our balance sheet by pursuing the divestiture of non-core assets, optimising our existing resources, and making targeted capacity investments aligned with our strategic growth priorities. Following the period end, the completion of the BII preference share conversion has materially simplified our capital structure, positioning the Group more strongly for the period ahead. With a solid operational foundation and a clear strategic direction, Zambeef is well-positioned for continued growth in the second half of the year and beyond.
Acknowledgements
I would like to extend my gratitude to our Board of Directors for their guidance and support. I am also indebted, to all our dedicated staff and partners, for their invaluable contributions to the ongoing success of the Group.
Faith Mukutu
Chief Executive Officer
Consolidated statement of profit or loss and other comprehensive income
Notes |
|
| ||
6 months to | 6 months to | Year to | ||
31 Mar 2026 | 31 Mar 2025 | 30 Sept 2025 | ||
K'000 | K'000 | K'000 | ||
Revenue from contracts with customers | 3 | 3,930,788 | 3,840,668 | 8,058,283 |
Change in fair value of biological assets | 7 | 722,852 | 876,122 | 1,102,125 |
Cost of sales | (3,143,576) | (3,308,655) | (6,234,772) | |
| ||||
Gross profit | 1,510,064 | 1,408,135 | 2,925,636 | |
| ||||
Other income | 11,286 | 22,568 | 23,380 | |
Other gains/(losses) | 46,267 | (49,319) | 4,759 | |
Net impairment losses on financial assets | (6,211) | (2,136) | (736) | |
Distribution expenses | (189,578) | (155,168) | (341,998) | |
Administrative expenses | (1,049,175) | (976,336) | (1,971,054) | |
| ||||
Operating profit | 322,653 | 247,744 | 639,987 | |
Finance costs | (239,817) | (200,638) | (407,677) | |
Finance income | - | 5,333 | 20,673 | |
| ||||
Profit before income tax | 82,836 | 52,439 | 252,983 | |
|
| |||
Income tax expense | 4 | (10,986) | (17,943) | (27,865) |
| ||||
Profit for the period | 71,850 | 34,496 | 225,118 | |
| ||||
Profit attributable to: |
| |||
Owners of Zambeef Products PLC | 72,703 | 34,365 | 225,820 | |
Non-controlling interests | (853) | 131 | (702) | |
| 71,850 | 34,496 | 225,118 | |
Other comprehensive income: |
| |||
Items that maybe reclassified to profit or loss |
| |||
Translation differences - foreign operations | 15,588 | (11,576) | 2,677 | |
Items not reclassified to profit or loss |
| |||
Revaluation surplus | 13,879 | - | 1,322,644 | |
Actuarial remeasurement losses | - | - | (558) | |
Deferred income tax | (1,542) | 2,453 | (137,300) | |
Other comprehensive loss for the period | 27,925 | (9,123) | 1,187,463 | |
|
| |||
Total comprehensive income for the period | 99,775 | 25,373 | 1,412,581 | |
Consolidated statement of profit or loss and other comprehensive income (continued)
Notes |
|
| ||
6 months to | 6 months to | Year to | ||
31 Mar 2026 | 31 Mar 2025 | 30 Sept 2025 | ||
K'000 | K'000 | K'000 | ||
Total comprehensive income for the period is attributable to: | ||||
Owners of Zambeef Products Plc | 100,628 | 25,242 | 1,412,747 | |
Non-controlling interests | (853) | 131 | (166) | |
99,775 | 25,373 | 1,412,581 | ||
| ||||
Basic earnings per share | Ngwee | Ngwee | Ngwee | |
Continued operations | 11 | 24.19 | 11.43 | 75.13 |
Total basic earnings per share | 24.19 | 11.43 | 75.13 | |
Diluted earnings per share | ||||
Continued operations | 11 | 18.15 | 8.58 | 56.37 |
Total diluted earnings per share | 18.15 | 8.58 | 56.37 | |
Consolidated statement of financial position as at 31 March 2026
| 31 Mar 2026 | 31 March 2025 | 30 Sept 2025 | |
ASSETS | Notes | K'000 | K'000 | K'000 |
Non-current assets |
| |||
Property, plant and equipment | 5 | 6,958,356 | 5,692,081 | 7,001,171 |
Goodwill | 6 | 25,015 | 25,015 | 25,015 |
Biological assets | 7 | 187,009 | 155,315 | 178,256 |
7,170,380 | 5,872,411 | 7,204,442 | ||
Current assets | ||||
Biological assets | 7 | 797,298 | 848,034 | 326,804 |
Inventories | 1,510,342 | 1,624,409 | 2,153,659 | |
Trade and other receivables | 487,284 | 450,930 | 314,329 | |
Cash and cash equivalents | 8 | 247,093 | 178,084 | 244,447 |
| 3,042,017 | 3,101,457 | 3,039,239 | |
Total assets | 10,212,397 | 8,973,868 | 10,243,681 | |
| ||||
EQUITY | ||||
Share capital | 3,006 | 3,006 | 3,006 | |
Share premium | 1,125,012 | 1,125,012 | 1,125,012 | |
Preference share capital | 1,000 | 1,000 | 1,000 | |
Foreign currency translation reserve | 647,528 | 623,443 | 634,911 | |
Revaluation reserve | 3,156,177 | 2,032,013 | 3,217,301 | |
Retained earnings | 1,550,196 | 1,215,532 | 1,404,032 | |
Attributable to owners of parent entity | 6,482,919 | 5,000,006 | 6,385,262 | |
Non-controlling interests (NCI) | (12,623) | (16,693) | (14,741) | |
| 6,470,296 | 4,983,313 | 6,370,521 | |
LIABILITIES | ||||
Non-current liabilities | ||||
Lease liabilities | 12,547 | 11,948 | 15,191 | |
Borrowings | 9 | 1,011,617 | 602,318 | 789,004 |
Deferred income tax | 303,006 | 162,380 | 297,570 | |
Defined benefit obligations | 2,202 | 1,843 | 2,060 | |
|
| 1,329,372 | 778,489 | 1,103,825 |
Current liabilities |
| |||
Lease liabilities | 11,113 | 16,369 | 11,698 | |
Borrowings | 9 | 1,441,969 | 1,765,266 | 1,583,870 |
Trade and other payables | 919,445 | 1,144,860 | 991,963 | |
Contract liabilities | 31,061 | 272,435 | 167,452 | |
Current income tax | 4 | 9,141 | 13,136 | 14,352 |
|
| 2,412,729 | 3,212,066 | 2,769,335 |
Total equity and liabilities |
| 10,212,397 | 8,973,868 | 10,243,681 |
Consolidated statement of changes in equity
| Share Capital | Share premium | Preference share capital | Foreign currency translation reserve | Revaluation reserve | Retained earnings | Total attributable to owners of parent entity | Non-controlling interests | Total |
| K'000 | K'000 | K'000 | K'000 | K'000 | K'000 | K'000 | K'000 | K'000 |
6 months ended 31 March 2025 (K) |
|
|
| ||||||
At start of period | 3,006 | 1,125,012 | 1,000 | 633,440 | 2,054,090 | 1,156,637 | 4,973,185 | (15,245) | 4,957,940 |
Profit for the period | - | - | - | - | - | 34,365 | 34,365 | 131 | 34,496 |
Other comprehensive income: |
|
| |||||||
Transfer of excess depreciation | - | - | - | - | (24,530) | 24,530 | - | - | - |
Deferred income tax | - | - | - | - | 2,453 | - | 2,453 | - | 2,453 |
Translation differences | - | - | - | (9,997) | - | - | (9,997) | (1,579) | (11,576) |
- | - | - | (9,997) | (22,077) | 24,530 | (9,997) | (1,579) | (9,123) | |
Total comprehensive income for the period | - | - | - | (9,997) | (22,077) | 58,895 | 26,821 | (1,448) | 25,373 |
|
| ||||||||
As at 31 March 2025 | 3,006 | 1,125,012 | 1,000 | 623,443 | 2,032,013 | 1,215,532 | 5,000,006 | (16,693) | 4,983,313 |
6 months ended 30 September 2025 |
|
|
|
|
| ||||
At start of period | 3,006 | 1,125,012 | 1,000 | 623,443 | 2,032,013 | 1,215,532 | 5,000,006 | (16,693) | 4,983,313 |
Profit for the period | - | - | - | - | - | 191,455 | 191,455 | (833) | 190,622 |
Other comprehensive income: |
|
| |||||||
Revaluation surplus | - | - | - | - | 1,322,644 | - | 1,322,644 | - | 1,322,644 |
Deferred income tax | - | - | - | - | (139,753) | - | (139,753) | - | (139,753) |
Actuarial remeasurement losses | - | - | - | - | - | (558) | (558) | - | (558) |
Translation differences | - | - | - | 11,468 | - | - | 11,468 | 2,785 | 14,253 |
- | - | - | 11,468 | 1,185,288 | (2,955) | 1,193,801 | 2,785 | 1,196,586 | |
Total comprehensive income for the period | - | - | - | 11,468 | 1,185,288 | 188,500 | 1,385,256 | 1,952 | 1,387,208 |
|
| ||||||||
As at 30 September 2025 | 3,006 | 1,125,012 | 1,000 | 634,911 | 3,217,301 | 1,404,032 | 6,385,262 | (14,741) | 6,370,521 |
6 months ended 31 March 2026 |
|
| |||||||
At start of year | 3,006 | 1,125,012 | 1,000 | 634,911 | 3,217,301 | 1,404,032 | 6,385,262 | (14,741) | 6,370,521 |
Profit for the year | - | - | - | - | - | 72,703 | 72,703 | (853) | 71,850 |
Other comprehensive income: |
|
| |||||||
Revaluation surplus | - | - | - | - | 13,879 | - | 13,879 | - | 13,879 |
Transfer of excess depreciation | - | - | - | - | (73,461) | 73,461 | - | - | - |
Deferred income tax | - | - | - | - | (1,542) | - | (1,542) | - | (1,542) |
Translation differences | - | - | - | 12,617 | - | - | 12,617 | 2,971 | 15,588 |
- | - | - | 12,617 | (61,124) | 73,461 | 24,954 | 2,971 | 27,925 | |
Total comprehensive income for the period | - | - | - | 12,617 | (61,124) | 146,164 | 97,657 | 2,118 | 99,775 |
|
| ||||||||
As at 31 March 2026 | 3,006 | 1,125,012 | 1,000 | 647,528 | 3,156,177 | 1,550,196 | 6,482,919 | (12,623) | 6,470,296 |
Consolidated statement of cash flows
|
|
| ||
| 6 months to 31 Mar 2026 | 6 months to 31 Mar 2025 | Year to 30 Sept 2025 | |
Notes | K'000 | K'000 | K'000 | |
Cash flows from operating activities | ||||
Cash generated from operations | 10 | 254,844 | 345,331 | 731,693 |
Interest paid on borrowings | (162,649) | (147,298) | (258,691) | |
Interest paid on bank overdrafts | (63,124) | (72,447) | (173,093) | |
Interest paid on leases | (1,822) | (2,032) | (4,079) | |
Benefits paid | (215) | (350) | (560) | |
Income tax paid | 4 | (12,303) | (13,064) | (26,332) |
Net cash inflow from operating activities | 14,731 | 110,140 | 268,938 | |
Cash flows from investing activities | ||||
Purchase of property, plant and equipment | (81,644) | (235,874) | (373,677) | |
Proceeds from disposal assets | 852 | 126 | 1,943 | |
Net cash outflow from investing activities | (80,792) | (235,748) | (371,734) | |
Cash flows from financing activities | ||||
Proceeds from borrowings | 625,356 | 293,615 | 1,402,558 | |
Principal repayments of borrowings | (394,643) | (392,389) | (1,404,646) | |
Principal elements of lease payments | (9,679) | (6,197) | (11,568) | |
Net cash in/(out)flow from financing activities | 221,034 | (104,971) | (13,656) | |
Net increase/(decrease) for the period |
| 154,973 | (230,579) | (116,452) |
Movement in cash and cash equivalents | ||||
At start of period | (489,607) | (387,865) | (387,865) | |
Net increase /(decrease) | 154,973 | (230,579) | (116,452) | |
Exchange differences | (4,766) | - | 14,710 | |
At period end | 8 | (339,400) | (618,444) | (489,607) |
Consolidated Statement of profit or loss and other comprehensive income
6 months to 31 Mar 2026 | 6 months to 31 Mar 2025 | Year to 30 Sept 2025 | |
US$'000 | US$'000 | US$'000 | |
Revenue from contracts with customers | 180,477 | 139,661 | 302,602 |
Change in fair value of biological assets | 33,189 | 31,859 | 39,275 |
Cost of sales | (144,333) | (120,315) | (232,015) |
| |||
Gross profit | 69,333 | 51,205 | 109,862 |
Other income/(expenses) | 518 | (973) | 878 |
Other net gains | 2,124 | - | 179 |
Net impairment losses on financial assets | (285) | (78) | (28) |
Distribution expenses | (8,704) | (5,642) | (12,843) |
Administrative expenses | (48,171) | (35,503) | (74,015) |
| |||
Operating profit | 14,815 | 9,009 | 24,033 |
Finance costs | (11,011) | (7,102) | (15,309) |
Finance income | - | - | 776 |
| |||
Profit before income tax | 3,804 | 1,907 | 9,500 |
|
| ||
Income tax expense | (504) | (652) | (1,046) |
Profit for the period | 3,300 | 1,255 | 8,454 |
| |||
Profit attributable to: |
| ||
Owners of Zambeef Products PLC | 3,339 | 1,250 | 8,480 |
Non-controlling interests | (39) | 5 | (26) |
| 3,300 | 1,255 | 8,454 |
Other comprehensive income: |
| ||
Items that maybe reclassified to profit or loss |
| ||
Translation losses on foreign operations | 716 | (421) | 101 |
Items not reclassified to profit or loss |
| ||
Revaluation surplus | 637 | - | 49,667 |
Actuarial remeasurement losses | - | - | (21) |
Deferred income tax | (71) | 89 | (5,156) |
Other comprehensive (loss)/income for the period |
1,282 |
(332) |
44,591 |
|
| ||
Total comprehensive income/(loss) for the period | 4,582 | 923 | 53,045 |
The supplementary information presented does not form part of the financial statements.
Consolidated Statement of profit or loss and other comprehensive income (continued)
6 Months to | 6 months to | Year to | |
31 Mar 2026 | 31 Mar 2025 | 30 Sept 2025 | |
| US$'000 | US$'000 | US$'000 |
Total comprehensive income for the period is attributable to: | |||
Owners of Zambeef Products Plc | 4,621 | 975 | 53,051 |
Non-controlling interests | (39) | (52) | (6) |
4,582 | 923 | 53,045 | |
| |||
Basic earnings per share | |||
Continued operations | 1.11 | 0.42 | 2.82 |
Total basic earnings per share | 1.11 | 0.42 | 2.82 |
Diluted earnings per share | |||
Continued operations | 0.83 | 0.31 | 2.12 |
Total diluted earnings per share | 0.83 | 0.31 | 2.12 |
The supplementary information presented does not form part of the financial statements.
Consolidated statement of financial position
31 Mar 2026 | 31 Mar 2025 | 30 Sept 2025 | |
ASSETS | US$'000 | US$'000 | US$'000 |
Non-current assets |
| ||
Property, plant and equipment | 362,414 | 202,709 | 292,814 |
Goodwill | 1,303 | 891 | 1,046 |
Biological assets | 9,740 | 5,531 | 7,455 |
373,457 | 209,131 | 301,315 | |
Current assets | |||
Biological assets | 41,526 | 30,201 | 13,668 |
Inventories | 78,664 | 57,849 | 90,074 |
Trade and other receivables | 25,379 | 16,059 | 13,146 |
Cash and cash equivalents | 12,869 | 6,342 | 10,224 |
| 158,438 | 110,451 | 127,112 |
Total assets | 531,895 | 319,582 | 428,427 |
| |||
EQUITY | |||
Share capital | 449 | 449 | 449 |
Share premium | 185,095 | 185,095 | 185,095 |
Preference share capital | 100 | 100 | 100 |
Foreign currency translation reserve | 33,725 | 22,202 | 26,554 |
Revaluation reserve | 168,210 | 72,365 | 134,559 |
Retained earnings | (49,928) | (102,149) | (79,703) |
Attributable to owners of parent entity | 337,651 | 178,062 | 267,054 |
Non-controlling interests | (657) | (594) | (617) |
| 336,994 | 177,468 | 266,437 |
LIABILITIES | |||
Non-current liabilities | |||
Borrowings | 52,688 | 21,450 | 32,999 |
Lease liabilities | 653 | 425 | 635 |
Deferred income tax | 15,782 | 5,783 | 12,445 |
Defined benefit obligations | 115 | 66 | 86 |
| 69,238 | 27,724 | 46,165 |
Current liabilities | |||
Borrowings | 75,103 | 62,866 | 66,243 |
Lease liabilities | 579 | 583 | 489 |
Trade and other payables | 47,887 | 40,771 | 41,490 |
Contract liabilities | 1,618 | 9,702 | 7,003 |
Current income tax | 476 | 468 | 600 |
| 125,663 | 114,390 | 115,825 |
Total equity and liabilities | 531,895 | 319,582 | 428,427 |
The supplementary information presented does not form part of the financial statements.
Consolidated statement of cash flows
|
|
| ||
| 6 months to 31 Mar 2026 | 6 months to 31 Mar 2025 | Year to 30 Sept 2025 | |
US$'000 | US$'000 | US$'000 | ||
Cash flows from operating activities | ||||
Cash generated from operations | 11,682 | 12,557 | 27,476 | |
Interest paid on borrowings | (7,468) | (5,356) | (9,714) | |
Interest paid on bank overdrafts | (2,898) | (2,634) | (6,500) | |
Interest paid on leases | (84) | (74) | (153) | |
Benefits paid | (10) | (13) | (21) | |
Income tax paid | (565) | (475) | (989) | |
Net cash inflow from operating activities | 657 | 4,005 | 10,099 | |
Cash flows from investing activities | ||||
Purchase of property, plant and equipment | (3,749) | (8,577) | (14,032) | |
Proceeds from disposal assets | 58 | 5 | 73 | |
Net cash outflow from investing activities | (3,691) | (8,572) | (13,959) | |
Cash flows from financing activities | ||||
Proceeds from borrowings | 28,712 | 10,677 | 52,668 | |
Principal repayments of borrowings | (18,120) | (14,269) | (52,747) | |
Principal elements of lease payments | (444) | (225) | (434) | |
Net cash in/(out)flow from financing activities | 10,148 | (3,817) | (513) | |
Net (decrease)/increase for the year |
| 7,114 | (8,384) | (4,373) |
Movement in cash and cash equivalents | ||||
At start of year | (20,478) | (14,614) | (14,565) | |
Net increase /(decrease) | 7,114 | (8,384) | (4,373) | |
Exchange differences | (219) | - | 552 | |
Translating Presentational Currency | (4,096) | 974 | (2,092) | |
At period end | (17,679) | (22,024) | (20,478) | |