Roundtable Discussion; The Future of Mineral Sands. Watch the video here.
- Home
- Share Prices
- AQSE Share Prices
- Euronext
- Stock Screeners
- Share Chat
- FX
- News & RNS
- Events
- Media
- Trading Brokers
- Finance Tools
- Members
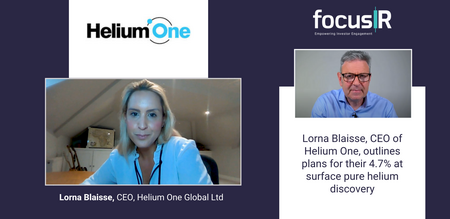
 View Video
Latest Share Chat
- LLOY. On the ftse 100 later today ...
- CNE. I'm truly Sorry to everyone ...
- OCN. I'm truly Sorry to everyone ...
- SND. For those unaware, Sondrel s...
- KOD. Well said!...
- PREM. The youtube vids from Prem h...
- UJO. 14 people disagree on that p...
- Share Prices
- Helium One Share Price
- Helium One Share Chat
 Helium One Share Chat (HE1)
- There are 0 new chat posts. Click here to refresh the page.
 HE1 Share
Price HE1 Share
News0 HE1 Share
Chat0 HE1 Share
Trades276 HE1
HE1
Live RNS0 HE1 Share
Charts HE1 Level 2
Console HE1 Live
Share Price HE1 Broker
Ratings0 HE1 Directors
Deals0 HE1 Financial
Diary HE1
HE1
Fundamentals HE1 Short
Positions0 HE1
HE1
Media0
Share Price Information for Helium One (HE1)
Watchlists are a member only feature
Login to your account
Don't have an account? Click here to register.Latest Helium One Video
Other Videos You Might Like
Share Discussion for Helium One
- You must be logged in to use filters Click here to login
Post a Message
- You must be logged in to post Click here to login
London South East prides itself on its community spirit, and in order to keep the chat section problem free, we ask all members to follow these simple rules. In these rules, we refer to ourselves as "we", "us", "our". The user of the website is referred to as "you" and "your".
By posting on our share chat boards you are agreeing to the following:
- You will only have one login account. Registering with multiple accounts is not allowed. Any user found to have more than one account on this site will have all, and any future accounts suspended permanently.
- Your email and password must only be used by you. If a post is made under your account, it will be considered that it was posted by yourself.
- Your account nickname must not be the same, or contain, listed company names or board members' names.
- While debating and discussion is fine, we will not tolerate; rudeness, swearing, insulting posts, personal attacks, or posts which are invasive of another's privacy.
- You will not;
- discuss illegal or criminal activities.
- post any confidential or price sensitive information or that is not public knowledge.
- post misleading or false statements regarding the share price and performance. Such posts are deemed as market abuse, and may be reported to the appropriate authorities.
- post any private communication, or part thereof, from any other person, including from a member of the board of directors of a listed company. Such posts cannot be verified as true and could be deemed to be misleading.
- post any personal details (e.g. email address or phone number).
- post live price or level 2 updates.
- publish content that is not your original work, or infringes the copyright or other rights of any third party.
- post non-constructive, meaningless, one word (or short) non-sense posts.
- post links to, or otherwise publish any content containing any form of advertising, promotion for goods and services, spam, or other unsolicited communication.
- post any affiliate or referral links, or post anything asking for a referral.
- post or otherwise publish any content unrelated to the board or the board's topic.
- re-post premium share chat posts on regular share chat.
- restrict or inhibit any other user from using the boards.
- impersonate any person or entity, including any of our employees or representatives.
- post or transmit any content that contains software viruses, files or code designed to interrupt, destroy or limit the functionality of this website or any computer software or equipment.
- If you are going to post non-English, please also post an English translation of your post.
- If you are going to post non-English, please also post an English translation of your post.
The IP address of all posts is recorded to aid in enforcing these conditions. As a user you agree to any information you have entered being stored in a database. You agree that we have the right to remove, edit, move or close any topic or board at any time should we see fit. You agree that we have the right to remove any post without notice. You agree that we have the right to suspend your account without notice.
Please note some users may not behave properly and may post content that is misleading, untrue or offensive.
It is not possible for us to fully monitor all content all of the time but where we have actually received notice of any content that is potentially misleading, untrue, offensive, unlawful, infringes third party rights or is potentially in breach of these terms and conditions, then we will review such content, decide whether to remove it from this website and act accordingly.
Premium and Verified Members
![]() Premium Members are members that have a premium subscription with London South East. You can subscribe here.
Premium Members are members that have a premium subscription with London South East. You can subscribe here.
London South East does not endorse such members, and posts should not be construed as advice and represent the opinions of the authors, not those of London South East Ltd, or its affiliates.
Thanks Trek - a comprehensive response to my simplistic reasoning!
ATB everyone.
The LSE algorithm used on this page only gauges a buy or sell according to if the trade was above or below the mid point at the time it ran.
So here are some facts.
# The published trades here can be 15mins late!
# If the spread is wide, there is no way of knowing what side of the mid point the trade was.
# If a sp falls quickly, say bad RNS, sells will look like buys as by the time the algorithm runs it puts a sell above the mid point and shows it as a buy.
# If a sp rises quickly, say good RNS, a buy will look like a sell as by the time the algorithm runs it will be below the mid point so the buy looks like a sell.
# Furthermore it there is a wide spread you may find some MM’s are so far apart from the mid point so how do you know if it’s a buy or sell.?
# If you use interactive investor you may get a prompt, we have improved your order by £162 so your buy may look like a sell when published as there was one MM with a better book.
# or the stock may be illiquid and there is only 1 MM with the min so they push the spread out, I have seen 40% spreads on AIM, to deter trades. Volume and liquidity are key to gauging value.
#For every buy there is at ‘some point’ a sell, why do you think the London Stock Exchange don't say buy or sell. It’s just a trade to them. It’s the aggressors price that is published. I.e the trade instigator. The simplest way to gauge the buy/sell demand is the SP trajectory, the volume, and the chart candles. So if sp is going up then overall they are being bought. The shares are overall in demand.
The chart here with good volume and good liquidity indicates that the shares are at the moment in demand so the price is rising. That’s about as sure as you can be.
Trek
£5
Be careful using the buy/sell volume..
I became a LTH of a share, thought I was buying cheap as buys frequently out paced the sells, but the price just kept falling.
Big trades going thru 1.3M - 12.30pm ......getting busy.....
@connexion,i was with share centre too, think ii are ok, but costs suit regular traders rather than buy and keepers
Business account doesn't sound good
Think yourself lucky you weren'y with the share centre.
I had two accounts a personal one and a business one (only because i have invested some company profit), both with £100 ,per year fee at share centre, taken over by ii who charge £120 (£10/mth) for the personal one and £600 (50/month) for the business one which very rarely trades!
Daylight robbery! The more they make the more others they take over and the more they'll charge. For a service which is automated it's a bl00dy disgrace.
NatePI,
That's great!!! Thank you. I have been trying to do this with the data displayed and copying the trades in an excel sheet :-))).
Of course it failed as I don't have the time and was missing a lot. Next thing was to use an active link to copy them as they scroll down.
I am not a day trader but I do it to learn and understand how the system of valuing the company based on buys and sells works. Also I want to see the time delay correlation between them.
I believe in numbers and I am not bad at them myself. The trick is always interpreting the data!!
Thank you again and if you have any more data tips they will be welcomed
Back to my day job now!! :-)
FlySea,
If you click the top left icon "HE1 Share Price" and scroll down, it will give you buys v sells, market cap, shares in issue etc.
I will add, it's not perfect and you should allow a 10% allowance each way as some buys do get recorded as sells and vice versa due to the very nature of the way it's recorded. However, it's equally never 50-100% incorrect, so if it's saying there's double the amount of sells then it could also be the case it's only 80-90% more sells.
A lot of BB participants will blindly ignore these crucial figures unless they're stacked in their favour so don't be fooled by anybody that tells you otherwise. Keep an eye on it, and watch how the MM pricing will swing throughout the day based on the number of buys v sells. You will see for yourself how they correlate.
Best, Nate
@NatePI Thank you for the info.
How to you get these totals? Is it available on Level 2 or you are doing some extra calculations too?
MMMmmm if thats correct then the MM's will have to raise the price or make a big loss.. 26p it is lol
Don’t be silly. You’ve even got L2, therefore can see all buys going though under mid. Don’t mess with the people who don’t know better.
Vol. Sold 12,160,523
Sold Value £3m
Vol. Bought 5,560,103
Bought Value £1m
Looking more likely that we'll see a drop into the afternoon based on the above to allow more buyers in before any further move up. There's been too much resistance selling here at ALH's for us to move up any further without the fresh buyers.