- Home
- Share Prices
- AQSE Share Prices
- Euronext
- US Share Prices
- Stock Tips
- Share Chat
- FX
- News & RNS
- Media
- Trading Brokers
- Finance Tools
- Members
Latest Share Chat
FTSE 100 technical update - Positive break higher today - Also a longer-term view
Thursday, 24th October 2019 13:55 - by Rajan Dhall
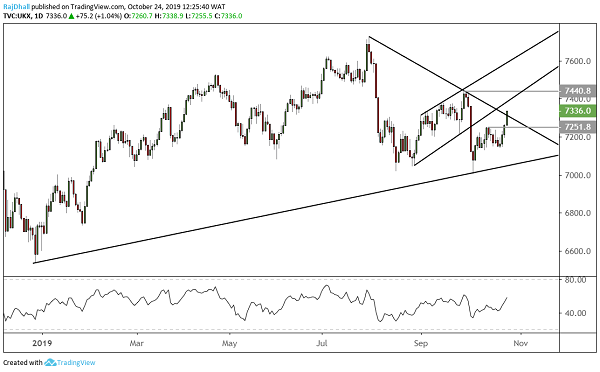
The FTSE 100 has broken the trendline that was touted to be a good signal the other day and now it's broken.
(https://www.lse.co.uk/blogs/expert/is-ftse-100-playing-catch-up.html) - Yesterday's post
Now the potential targets are pointing to the upside again on the longer term.
The daily chart below shows the break and the possible next wave targets that are from the previous wave high.
Often with a trendline break, we see a retest so patience is needed from time to time.
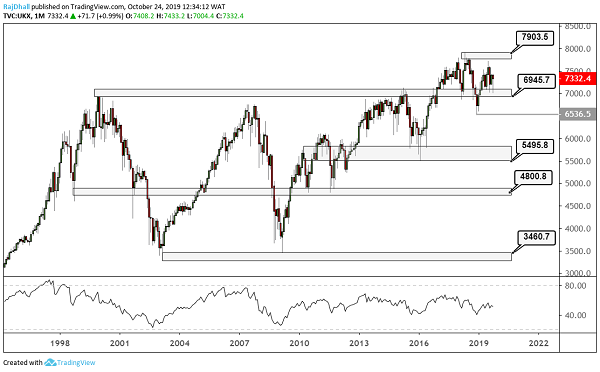
Lower down in the article I will also put in a monthly chart so we can check out an even longer-term view.
Politically as suggested there is a bit of ambiguity surrounding the Brexit timetable. The new term has been crowned the "Flextension".
France seems to be the member state that is more urgent but it is hard to predict this until we hear directly from Tusk or Junker.
Elsewhere, today is the last meeting for outgoing ECB president Mario Draghi. This zero interest rate and QE policy was an investors dream and now Christine Lagarde looks to be cut from the same cloth. In the UK although we have not kickstarted QE again the BoE has said there would be some help for the markets in the case of any Brexit impact. But let's get Brexit out of the way first.
The monthly chart is obviously a longer-term view but I feel it is very important to show how deep some corrections normally are and the pattern of the current trend. The trend corrected to 6536.5 this is the level to beat if the market is to confirm a trend correction lower. It will make a new lower high lower low pattern if it is the case but currently we are still in an uptrend but with a lower high wave.
Since the financial crisis, the rally has been pretty impressive and 7903.5 is the target to beat on the upside. If this gets taken out we can assume the uptrend is set to continue. Central banks around the world have started easing again and for years the sceptics have been saying a crash is coming. Also, the 7000 psychological level is providing some support for the bulls and on the daily chart above you can see some bullish candle patterns around that number.
In April to mid-2012 there was another lower high that formed but the market failed to make a lower low. I will leave you with this thought as look at how things ended up since that point. If we cannot make a lower low could the trajectory be higher longer-term?
The Writer's views are their own, not a representation of London South East's. No advice is inferred or given. If you require financial advice, please seek an Independent Financial Adviser.