- Home
- Share Prices
- AQSE Share Prices
- Euronext
- US Share Prices
- Stock Tips
- Share Chat
- FX
- News & RNS
- Media
- Trading Brokers
- Finance Tools
- Members
Latest Share Chat
FX outlook - It's all about tapering
Friday, 4th June 2021 09:26 - by Rajan Dhall

Central bank talk has completely shifted from pandemic stimulus and pandemic recovery and pandemic vaccination rates to tapering. Just this week the U.S. Federal Reserve announced they are selling off some of their pandemic bond and ETF purchases. The Secondary Market Corporate Credit Facility (SMCCF), held around $5.21 billion of bonds from companies including Whirlpool Corp., Walmart Inc., and Visa Inc. as of April 30. In addition to this, it also held $8.56 billion of exchange-traded funds that hold corporate debt, such as the Vanguard Short-Term Corporate Bond ETF. Amazingly it doesn't stop there as the SMCCF’s corporate debt holding still holds more than $7.3 trillion of Treasury debt and agency mortgage-backed securities on the Fed’s balance sheet.
To put these astonishing numbers in perspective we must still remember that the Fed is still purchasing $120 billion a month in the form of its general QE program. So in relative terms them stopping this SMCCF purchase round and selling some of the assets off is relatively small. The market implications however are big. Traders and investors are now betting that this could be the start of the main pandemic taper. Indices in the U.S. and Europe traded weaker today (Thursday) and the dollar rallied.
Philadelphia Fed President Patrick Harker has been quoted as saying it is “Time to ‘think about thinking about tapering". This current move by the Fed is not really tapering as this facility was just technical in nature to provide credit during the pandemic but it is getting the street thinking about the timing of the Fed's next move.
The dollar index weekly chart below shows the extent of the move this week. The current candle looks like it will engulf the last two weeks ranges and the bulls could now take aim at the red support zone near 91.60. Beyond that, if the move really gathers momentum the purple zone could be the next resistance to watch. On the downside, just recently it seems like the bears would inevitably reach the orange support level. Alas, they have failed and only time will tell if we will move another leg lower.
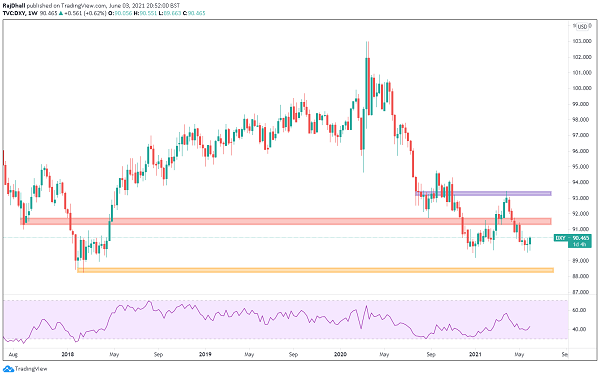
Source: TradingView
This chart is one of the most technically interesting at the moment. AUD/CAD is effectively metals vs oil at the moment and oil is having one heck of a run. Having said that copper, iron ore, and gold have not been weak themselves but adding in a bit of macro will tell you that Australia's problems with China could be one of the reasons that AUD has been struggling.
At the moment the price is heading to a very important support level (purple area). This zone confluences with the 38.2% Fibonacci retracement and in its own right has seen a good price bounce in the past. If the level does break the next support could be the green area at 0.9135 but it has been more of a historical resistance rather than a zone support recently.
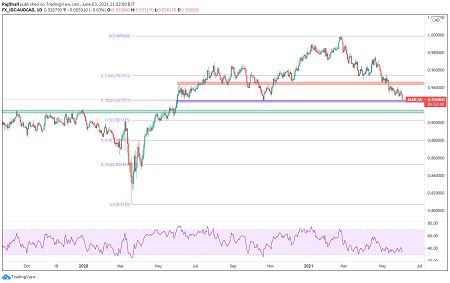
Source: TradingView
The Writer's views are their own, not a representation of London South East's. No advice is inferred or given. If you require financial advice, please seek an Independent Financial Adviser.