- Home
- Share Prices
- AQSE Share Prices
- Euronext
- Stock Screeners
- Share Chat
- FX
- News & RNS
- Events
- Media
- Trading Brokers
- Finance Tools
- Members
Latest Share Chat
Commodities Round up: Is this the time to look at miners again?
Friday, 14th May 2021 09:34 - by Rajan Dhall
This week in the macro markets U.S. CPI stole the show. This week the consumer price index (CPI) print in the U.S. rose at its fastest pace since 2008. This led the world's indices to wobble and the dollar to have a brief comeback.
The analyst consensus for the reading was around 3.6% (year-on-year) and the actual number smashed this to hit 4.2%. This presents the Federal Reserve (Fed) with a problem as they have noted they are willing to handle an overshoot but few expected a rate this high. A central bank would normally raise rates if inflation looked like it was moving out of control but the Fed has been adamant they will wait for full employment before raising rates. This leaves them stuck between a rock and a hard place.
From a commodities perspective, gold took a dive after the numbers were digested. If there is another safe-haven asset (US yielding) that is offering a fixed income return that would obviously put pressure on gold.
In an immediate reaction to the news, U.S. Treasury yields pushed higher as traders and investors started betting that the Fed would have to act. Gold has been moving higher in recent weeks so this inflation news threw a spanner in the works. The question is if the data will continue to stall the Fed. The last non-farm payroll result was enough to keep them at bay for now but how long will that last.
Looking at the daily gold chart below it's clear to see the sell-off on the day of the CPI data. On Thursday the price has recovered some of the move but until the top of the candle (Wednesday's) is taken out there is a strong argument the price could continue lower.
For now, the chart is still telling us that the waves are making higher highs and higher lows but there are two key levels ahead of us. One is the downward sloping black trendline. If this breaks we could be looking at a longer-term change in trend. The other is the $1875/oz level (marked in green), if this breaks then the bulls could take a run-up to the next major resistance closer to the $2000/oz level. Until those two levels are broken it's hard to be too bullish on the yellow metal in the long-term.
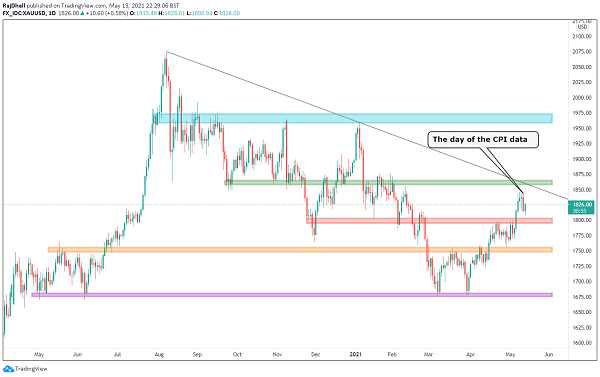
Source: TradingView
Let's talk about some mining stocks now. Copper is still near the recent highs, iron ore is still near its recent highs. There could be no real rational reason for concern that this global pullback will affect miners long-term. Year to date on the FTSE 100, the miners are still the best-performing stocks in the index. Evraz (LSE:EVR), Glencore (LSE:GLEN), Anglo American (LSE:AAL), and Antofagasta (LSE:ANTO) are all still in the top 10 (year to date) and BHP (LSE:BHP) has recently overtaken Unilever to be the biggest stock in the index (market cap). If we see even a 15% retracement in the copper price their margins on the commodity would still have increased heavily. The supply vs demand gap in the base metal still could have a long way to go, the commitment from the world's governments to hit their environmental targets seems solid and there is the fiscal stimulus to back this up.
Below is the weekly BHP Group share price chart and as you can see we are not too far off the all-time high (marked in the orange shaded area). At the moment the price is experiencing a small pullback and this could be another opportunity to enter but there are some levels on the downside that could be important. If the retracement is slightly deeper then the green area may come into play and it has been used as a wave high resistance in June 2019 and often resistance can become support. Beyond that, the psychological 2K area could be next up followed by the purple zone just ahead of 1800p. For now, even though there is a pullback the bulls look firmly in charge as the general trend is moving higher but another technical resistance to watch could be the upward slanting trendline, if the current price trajectory remains the same it could meet the price at around 2600p. For now, this looks like nothing more than a blip in an otherwise solid trend.
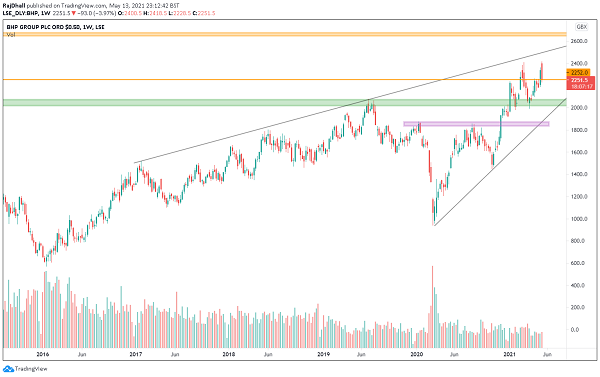
Source: TradingView
The Writer's views are their own, not a representation of London South East's. No advice is inferred or given. If you require financial advice, please seek an Independent Financial Adviser.