- Home
- Share Prices
- AQSE Share Prices
- Euronext
- US Share Prices
- Stock Tips
- Share Chat
- FX
- News & RNS
- Media
- Trading Brokers
- Finance Tools
- Members
Latest Share Chat
FTSE 100 Technical Analysis Update
Wednesday, 28th August 2019 08:49 - by Rajan Dhall
The FTSE 100 is still looking weak despite a small pick up in sentiment over the last few days in the equities space.
Although last Friday China and Trump went slightly mental the US indices recovered more than in the UK.
GBP/USD has recovered slightly and this could be stemming gains in the UK's major index.
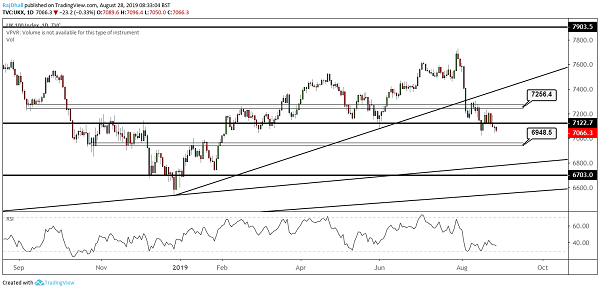
On the daily chart below, the 7122 level marked by the black horizontal line is a key level. It was drawn on the weekly chart but even on the daily has been used to good effect. Now we are below that zone but only just, we need to see if the market closes below the level on the weekly close. In terms of the next support, the 7000 psychological level is nearby but also 6948. On the topside, 7256 could stop any rallies in their tracks but for now, the bearishness looks set to continue. For the trend of lower highs and lower low waves to continue, 7020 is the next wave low that needs to be broken and the price is very close to a test. My only concern is the momentum as the move lower seems to be slowing down, as the RSI indicator is showing signs of divergence.
The Writer's views are their own, not a representation of London South East's. No advice is inferred or given. If you require financial advice, please seek an Independent Financial Adviser.