- Home
- Share Prices
- AQSE Share Prices
- Euronext
- US Share Prices
- Stock Tips
- Share Chat
- FX
- News & RNS
- Media
- Trading Brokers
- Finance Tools
- Members
Latest Share Chat
FTSE 100 technical analysis
Thursday, 28th November 2019 15:01 - by Rajan Dhall
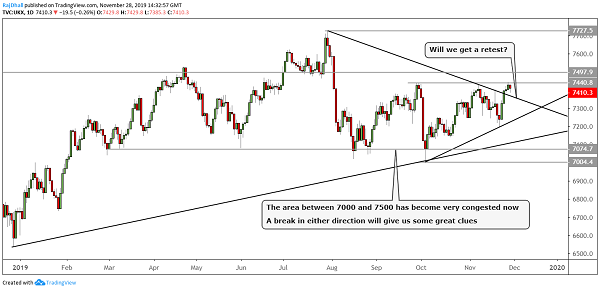
FTSE 100 Daily Chart:
The price broke out of the trendline recently but stopped at the previously touted 7440.8 resistance zone.
Today we have seen a small pullback and currently, trade 0.27% lower.
Often when price breaks a trendline there is a retest. We will have to see if it is the case in this instance.
Also on the chart, it is clear that the area between 7000 and 7500 are becoming very congested.
For the bulls, on the upside, a break of 7440.8 is key with a daily close above the level.
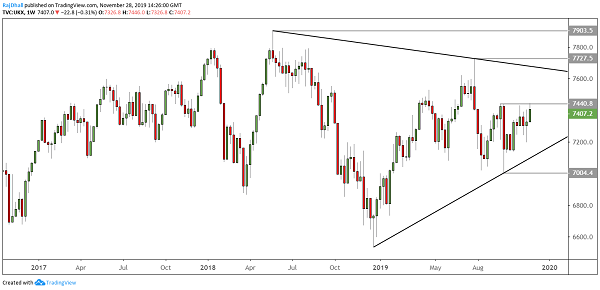
FTSE 100 Weekly Chart:
The weekly chart shows a more bullish scenario. The candle last week is a hammer candle and now this weeks candle has been pretty bullish so far.
Again the key level is 7440.8 and if we see a break there the upside targets could be 7727.5 and the highs of 7903.5.
The Writer's views are their own, not a representation of London South East's. No advice is inferred or given. If you require financial advice, please seek an Independent Financial Adviser.