- Home
- Share Prices
- AQSE Share Prices
- Euronext
- US Share Prices
- Stock Tips
- Share Chat
- FX
- News & RNS
- Media
- Trading Brokers
- Finance Tools
- Members
Latest Share Chat
Commodities Focus - Major commodities hang at elevated levels
Friday, 11th June 2021 09:43 - by Rajan Dhall

As suggested in the last few weeks commodities comments the Chinese crackdown on commodities prices are playing havoc with base metals.
Copper traded lower last week and at the time of writing the red metal has moved 0.59% in the red. Interestingly some of the market commentary coming out of the major investment banks are still backing base metals to rise again especially ones that linked to the electric vehicle market.
In this week's commodities focus, I will be looking at the charts in some detail. The fundamentals are still firmly in favour of price rises but if the U.S. dollar gets stronger it could throw a spanner in the works. The equities markets are fixated on the inflation story so that is one theme you equities bulls will need to keep an eye on.
The monthly copper futures chart below shows the price is now stuck between two strong levels. The resistance is coming from the February 2011 high and although the price printed above the level there was no close above the price zone. On the downside, the next support could be at the May 2008 high and recently in February of this year the level was used as a resistance zone and from a technical perspective resistance often becomes support once it is broken. Another very important point to highlight from the chart is the increasing buying volume. The histogram at the bottom of the chart is showing as the buying candles gather pace the size of the volume is also increasing too. All in all, this is still a very bullish market. There had to be a pause for breath at some stage and the question is how long will it last.
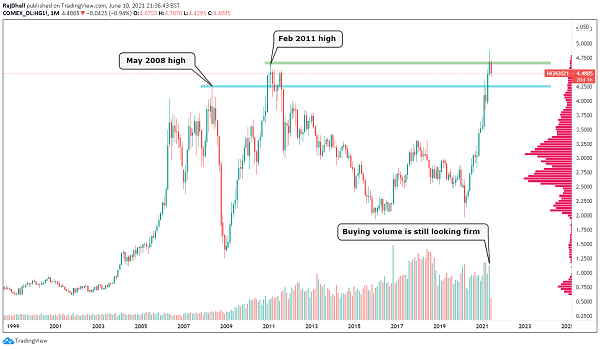
Source: TradingView
Another asset class that is causing inflationary issues is oil. The rolling WTI futures contract below shows the price has breached $70/bbl this week. The last time WTI prices were this high was in 2018. On the options market, there have been some bullish calls with some premiums rising at the $100/bbl level. Before that price, the next level of resistance is at the green zone just under $80/bbl. There has been lots of price activity around that level and it was the previous wave high from the aforementioned period in 2018. Nevertheless, the trend is still very firm and is showing no signs of slowing down at the moment. If there is to be a break of the green zone the $100/bbl level could be next. Since the trendline break marked on the chart the price has not looked back and there is not to much suggesting that this train is slowing down.
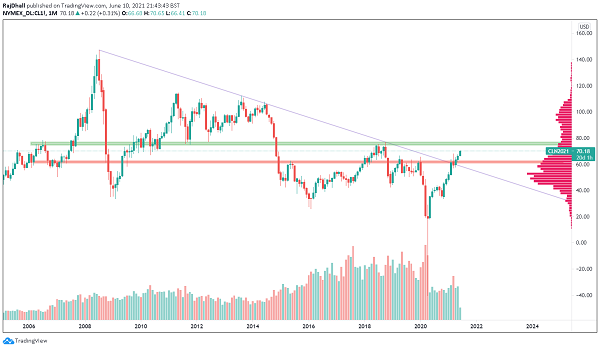
Source: TradingView
The weekly gold chart is showing that the yellow metal could be running out of momentum. Having said that the price is trading half a percent higher this week and the inflation story seems to be sticking at present. The next area of note is the 0.618% Fibonacci retracement level and if the price conclusively closes above that level then the market could be more convinced that the previous all-time high could be tested. Of course, the psychological $2K/oz level is there but the main technical resistance could come just ahead of that at $1961.4/oz. The jury is still out on if this is just a retracement or the beginning of a reversal and in the coming weeks, we could see if the next resistance is broken.
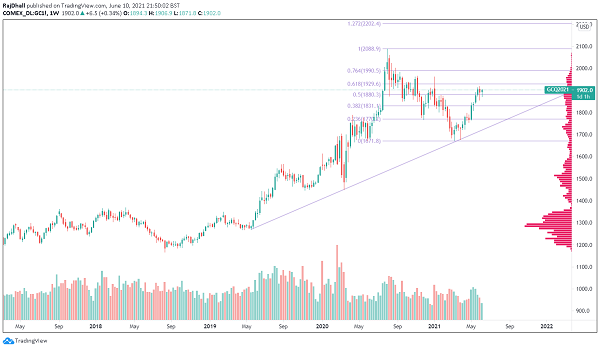
Source: TradingView
The Writer's views are their own, not a representation of London South East's. No advice is inferred or given. If you require financial advice, please seek an Independent Financial Adviser.