- Home
- Share Prices
- AQSE Share Prices
- Euronext
- US Share Prices
- Stock Tips
- Share Chat
- FX
- News & RNS
- Media
- Trading Brokers
- Finance Tools
- Members
Latest Share Chat
Marks and Spencer - Solid technical formation
Thursday, 5th December 2019 14:04 - by Rajan Dhall
As the regular readers will know I am not a fan of High St. stores at the moment but this stock has caught my attention. The issues with the M&G commercial property fund have highlighted how bad the retail situation is right now. Let's hope this will lead to a fall in rents and a potential boost in retail stocks.
As a technical analyst, I tend to ignore the fundamental data and focus on the price patterns and trend.
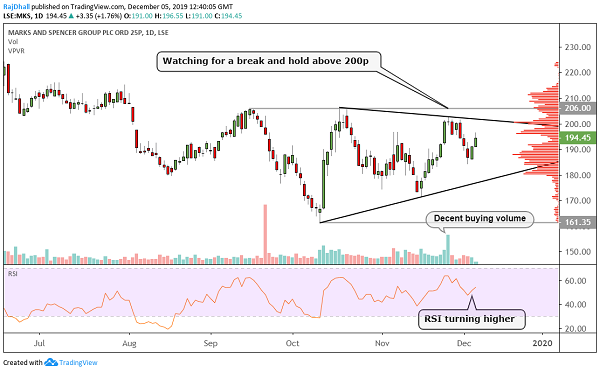
Looking at the chart now, The price has descended into this triangle consolidation pattern and now is headed to the key psychological 200p level. A break of that level would take out the pattern too, which is a bullish signal.
206p is the resistance zone. This is the wave high that needs to be broken to confirm the move higher. Also on the daily chart, the volume is heading higher backing the move and the RSI is also holding above 50 and tilting up.
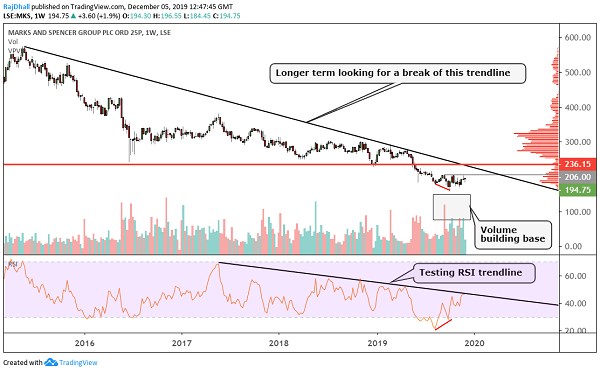
On the weekly chart, there has been a divergence on the RSI (marked with red line). This is when the price makes lower lows and the indicator makes a higher low. This is an indication that selling momentum may be slowing down. If the 206p level breaks the weekly chart is showing another resistance at 236.15p this could be a potential target. Much longer-term a break of the trendline would be a bullish signal. Lastly, on the RSI indicator, there is also a trendline that is currently being tested, once again if this breaks it could mean good news for the share price.
I must say that this is a very bearish chart so any move higher would have to be backed with good volume and the confirmation signals would need to be achieved for a better indication of a longer-term trend change.
The Writer's views are their own, not a representation of London South East's. No advice is inferred or given. If you require financial advice, please seek an Independent Financial Adviser.