- Home
- Share Prices
- AQSE Share Prices
- Euronext
- US Share Prices
- Stock Tips
- Share Chat
- FX
- News & RNS
- Media
- Trading Brokers
- Finance Tools
- Members
Latest Share Chat
FTSE 100 Technical Analysis
Friday, 5th July 2019 09:42 - by Rajan Dhall
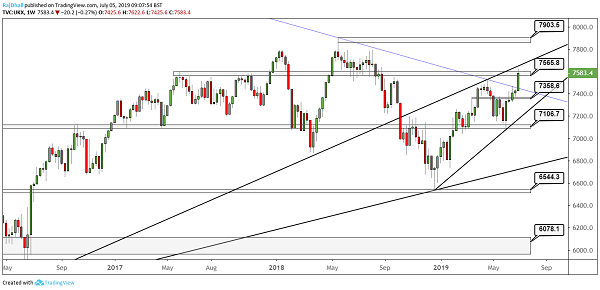
(Weekly Chart)
In a firm week for stocks in the UK, it seems the FTSE 100 has broken a key longterm trendline to trade higher. The trendline is marked by the blue downward sloping line on the chart and the break came at around the 7460 area. Price has now stopped at the 7585 resistance zone which was used as a consolidation low point between May - September 2018.
Looking forward, the tend looks like it has enough momentum to continue but often when such a powerful break happens we do get a pullback. Today we have the catalyst for such an event as it is the non-farm payroll reading in the US. If the number comes in weak it could signal a more accommodative Fed so equities could rise. Beware, some of this strength is down to GBP weakness so if the GBP/USD pair gains some strength that could hinder the progress of the UK's largest index.
There are two main targets higher up and the obvious one is the previous high of 7903.5. The second is the black internal trendline, these are often a powerfull point where price hesitates. On the downside, there could be a test of the blue trendline so it's worth keeping in your charts. Lastly, the previous wave high of 7528.9 could be an area where price could bounce.
Kind Regards
Rajan Dhall
The Writer's views are their own, not a representation of London South East's. No advice is inferred or given. If you require financial advice, please seek an Independent Financial Adviser.