- Home
- Share Prices
- AQSE Share Prices
- Euronext
- US Share Prices
- Stock Tips
- Share Chat
- FX
- News & RNS
- Media
- Trading Brokers
- Finance Tools
- Members
Latest Share Chat
FTSE 100 Technical Analysis
Tuesday, 10th December 2019 11:15 - by Rajan Dhall
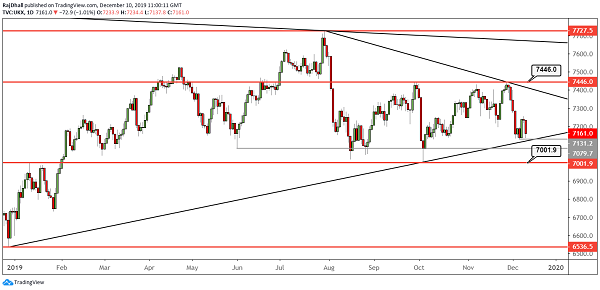
The FTSE 100 has moved lower in the range once again. Below is the daily chart and just when it seemed like the price might start moving higher yesterday an indecision Doji candle appeared. Then today the prices have moved lower with market commentators saying the sluggish GDP data is the cause. I dont really buy this as GBP/USD continues to push higher and that is the likely cause for the weakness in the FTSE 100 index. General equities sentiment is jittery today, as Trump and Xi continue their trade talks ahead of the next set of tariffs, which could be enacted on December 15th.
Looking deeper into the technicals on the chart now, the support level in focus will be at 7131.7. This is the previous wave low and if it is taken out 7079 lies in wait. For longer-term support, bulls must look lower closer to the 7K psychological level and 7001.9 did get used to good effect in October (support) and early 2019 as resistance. Of course, the price has not closed and technical analysts will wait to see the extent of the bearishness closer to 16.30 pm.
Over a longer-term horizon, traders must bear in mind that the FTSE 100 is lagging behind the likes of the S&P, Dow and ASX. Once the election and Brexit is out of the way could we see a move to catch up with its peers?
The Writer's views are their own, not a representation of London South East's. No advice is inferred or given. If you require financial advice, please seek an Independent Financial Adviser.