- Home
- Share Prices
- AQSE Share Prices
- Euronext
- Stock Screeners
- Share Chat
- FX
- News & RNS
- Events
- Media
- Trading Brokers
- Finance Tools
- Members
Latest Share Chat
Commodities Round-up: Could China throw a spanner in the works?
Friday, 21st May 2021 12:52 - by Rajan Dhall

The commodities markets have had an interesting time over the last couple of weeks and there has been a retracement followed by a mild recovery.
Copper is still trading around 8% away from the high seen on 10th May. The likes of iron ore and lumber have also had a pullback but in fairness, prices had been pretty overextended after a serious price rally. The key story to come out of the last week has been from China.
The Chinese administration has said more effort needs to be taken to prevent rising commodity prices from being passed through to consumers. This is a massive warning sign. “Commodity inflation has pushed China to meaningfully slow credit growth this year and implement non-monetary measures designed to slow construction capex growth, one of the main drivers for materials demand,” KeyBanc Capital Markets analysts led by Philip Gibbs wrote in a note.
“Traditionally, this has been a bearish signal for commodity stocks.”. So in essence are the Chinese government going to tighten lending to restrict the growth of commodities markets? only time will tell. At the moment it is clear that demand is outstripping supply.
The manufacturing PMI's around the world today have noted this in great detail. Markit have noted in all the reports that there is a backlog from demand and product souring is becoming more and more difficult.
The rise in shipping costs is also a factor at the moment and the Baltic Dry index is near its recent highs highlighting the fact that inflation is running red hot.
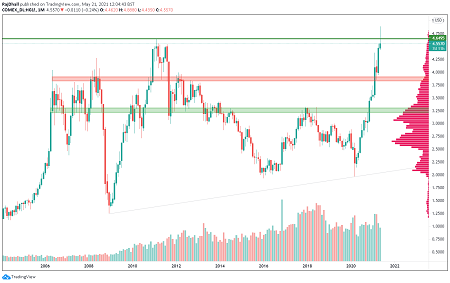
On the technical side, on the monthly copper futures chart, the price has retraced from the all-time high back below the wave high from February 2011.
The question is, is it's going to stay there? The technical factors look good but we will need a close and hold above $4.55/lb to confirm it.
Volume is still on the up but on a lower timeframe (daily) if we do get another move up it will be interesting to see if it is on increasing volume.
On the downside, if the price does fall the $4/lb area looks strong and that could just be a natural retracement area before the prices resume the current uptrend. This move up has not had any real retracements on the monthly chart as of yet. So eventually it would not be unreasonable to expect this could happen.

Source: TradingView
The inflation fears have helped gold prices push higher over the last week or so. More importantly, has the demise of Bitcoin also been a factor.
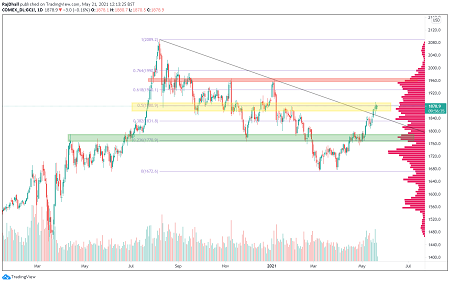
At the moment the gold price is in a critical area, the 50% Fibonacci retracement has confluence with a level that has many touches in the past.
On the upside, the red area is where things get interesting. If the price breaks the zone it looks like a test of $2k/oz will be on the cards.
If for some reason the bulls lose momentum the green zone near $1800/oz is the one to watch. The price has spent a fair amount of time there and there are three massive reaction points on the chart below at that price area. For now, the bulls have taken charge of this market and if there is a natural retracement then the trendline support would be the first point of call.

Source: TradingView
The Writer's views are their own, not a representation of London South East's. No advice is inferred or given. If you require financial advice, please seek an Independent Financial Adviser.

