Today 07:00

2 July 2026
TRIFAST PLC
FULL YEAR 2026 RESULTS
Audited results for the year ended 31 March 2026
Profitability and margins advance, supported by continued focus on revenue quality
Clear line of sight to 10%+ EBIT margins
Trifast plc ('Trifast' or the 'Group', LSE: TRI.L), the international specialist in the design, engineering, manufacture, and distribution of high-quality engineered fastenings, today announces its audited results for the full year ended 31 March 2026 ('FY2026' or 'FY26').
Financial highlights
· Resilient FY26 performance delivered through disciplined execution, despite a challenging macroeconomic and geopolitical backdrop.
· Revenue down 7.3% to £207.1m (CER) and down 6.7% to £208.4m (AER) (FY25: £223.5m), as anticipated, reflecting softer market demand alongside the strategic decision to focus on the quality of revenue.
· Gross margin increased to 30.0% (CER) (FY25: 28.3%), supported by pricing discipline, mix improvement and structural efficiency benefits.
· Underlying EBIT increased to £16.3m (CER) (FY25: £14.9m), with EBIT margin improving to 7.8% (CER) (FY25: 6.7%) through continued margin management and operational efficiency actions.
· Underlying PBT increased to £12.3m (CER) (FY25: £10.4m), with £0.3m reduction in net finance costs.
· Profit before tax was £0.1m (AER) (FY25: £4.9m), after Separately Disclosed Items, including £6.0m of Project Ignite costs expensed in the year rather than capitalised, reflecting the accounting treatment for cloud-based implementation costs.
· Adjusted net debt reduced to £16.0m (FY25: £17.4m), with leverage improving to 0.75x (FY25: 0.97x) and cash conversion of underlying EBITDA remained strong at 94.1% (FY25: 100.2%).
· ROCE further improved to 8.5% (FY25: 8.1%).
· Dividend increased to 1.90p per share (FY25: 1.80p), in line with our progressive dividend policy and confidence in future cash generation.
Operational and strategic highlights
· Delivered the first year of the Rebuild phase of the Group's Recover, Rebuild, Resilience strategy, expanding EBIT margin to 7.8% despite softer revenue and well on track to deliver the medium-term target of >10% EBIT margin
· Project Ignite / Microsoft D365 remains a key transformation programme, supporting better data, stronger controls, inventory visibility and scalable growth across key markets. Project delivery is progressing as planned, with spend appropriately controlled.
· Shared Service Centre capability in Hungary, the Malaysia manufacturing exit and continued process standardisation supported a leaner operating model.
· Portfolio focus continued to shift towards higher-value customers and verticals, with Smart Infrastructure now 17% of the portfolio and targeted to reach 30% by FY30, supported by strong underlying demand and growth across applications including HVAC, power distribution, data connectivity and water infrastructure.
· North America delivered growth, supported by Smart Infrastructure and Medical, while Europe and UK & Ireland protected profitability despite lower revenue; India is scaling rapidly with strong FY27 momentum.
· Bolt-on acquisitions targeted in specific geographic or industry growth areas.
Outlook
· The Group enters FY27 with improved operational and financial strength, structurally stronger margins, enhanced earnings visibility and a clear path back to profitable top-line growth, focused on key growth regions of North America and Asia.
· Positive momentum has continued into FY27, with the commercial pipeline the strongest since the strategy was implemented.
· Targeted internal investment supports further structural improvement, including ERP enablement and disciplined capital expenditure, enhancing pricing capability, operational efficiency and supporting margin expansion and cash generation.
· The Group continues to prioritise growth in Smart Infrastructure and Medical, where technical fit and resilience are stronger, supporting a more diversified, higher-quality growth mix.
· Macro challenges are being actively managed through robust forecasting, cost discipline and a structurally stronger operating model, supporting the Board's confidence in the Group's outlook.
· The Board remains confident in achieving the Group's medium-term EBIT margin target of >10%, underpinned by structural improvements in efficiency, mix and pricing.
Iain Percival, CEO of Trifast, said:
"We are delivering what we said we would do: improving EBIT margins through disciplined, sharper execution and focused strategic change.
FY26 demonstrates that the Rebuild phase is working. We grew profits and expanded margins in a softer revenue environment, reflecting a deliberate focus on quality of revenue over volume.
Our pipeline is the strongest since the strategy was implemented. With increasing exposure to higher-growth areas such as Smart Infrastructure, Medical Equipment and India, and supported by scalable systems and improved commercial execution, we are well positioned to transition from rebuilding margins to rebuilding revenue.
We are increasingly acting as a mission-critical embedded partner within our customers' supply chains, supporting higher-quality, more resilient growth. The path to a 10%+ EBIT margin remains clear and we are on track to deliver it.
I would like to thank all Trifast employees for their continued commitment in delivering this progress."
*Consensus forecasts for FY26 prior to this announcement were: revenue of £207m, underlying EBIT of £16.0m and underlying PBT of £11.7m (AER).
Forward Looking Statements
This document may contain certain forward-looking statements. The forward-looking statements reflect the knowledge and information available to the Company during the preparation and up to the publication of this document. By their very nature, these statements depend upon circumstances and relate to events that may occur in the future thereby involve a degree of uncertainty. Therefore, nothing in this document should be construed as a profit forecast by the Company.
The following information contained within this announcement is a summary extracted from the Group's audited financial statements and Annual Report 2026.
Unless stated otherwise, amounts and comparisons with prior year are calculated at constant currency (Constant Exchange Rate (CER)). Where reference is made to 'underlying' this is defined as being before separately disclosed items.
Summary of Group's FY26 financial performance
CER² | CER² | AER² | AER² | AER² | |
Underlying measures | FY26 | Change | FY26 | Change | FY25 |
Revenue | £207.1 m | (7.3%) | £208.4m | (6.7%) | £223.5m |
Gross profit margin % | 30.0% | 170 bps | 30.0% | 170 bps | 28.3% |
Underlying EBIT | £16.3 m | 9.4% | £16.5 m | 10.7% | £14.9m |
Underlying EBIT margin % | 7.8% | 110 bps | 7.9% | 120 bps | 6.7% |
Underlying Profit before tax | £12.3m | 18.3% | £12.3m | 18.3% | £10.4m |
Underlying Diluted earnings per share | - | - | 6.46p | 49.9% | 4.31p |
GAAP measures | |||||
EBIT | £4.2m | (55.3%) | £4.2m | (55.3%) | £9.4m |
EBIT margin % | 2.0% | (220) bps | 2.0% | (220) bps | 4.2% |
Profit before tax | - | - | £0.1m | (98.0%) | £4.9m |
Diluted earnings per share | - | - | (0.73)p | (1.56)p | 0.8p |
Dividend per share | - | - | 1.90p | 0.10p | 1.80p |
Adjusted leverage ratio | - | - | 0.75x | (0.22) | 0.97x |
Adjusted net debt | - | - | £ (16.0)m | (8.0%) | £(17.4)m |
Return on capital employed (ROCE) | - | - | 8.5% | 40 bps | 8.1% |
1. Before separately disclosed items (see note 1 of this announcement)
2. CER being Constant Exchange Rate, calculated by translating the FY2026 figures by the average FY2025 exchange rate, and AER is actual exchange rate
3. Adjusted leverage ratio is calculated using adjusted net debt against adjusted underlying EBITDA. Adjusted metrics exclude the impact of IFRS 16 Leases (see note 1 of this announcement)
FY26 Results presentation
An in-person and virtual presentation for analysts and institutional investors will be held at 10 A.M. BST today at the office of Trifast plc, 2-6 Boundary Row, London SE1 8HP. Please contact companysecretariat@trifast.com for details.
The Company will also be presenting the FY26 results via the Engage Investor platform on 7 July 2026 at 1 P.M. BST and welcomes all current shareholders and interested investors to join. We encourage you to pre-submit questions, but you can also submit your questions during the live presentation.. To register for the presentation, please use this link: https://engageinvestor.news/TRI_IP26
This announcement contains inside information for the purposes of Article 7 of the Market Abuse Regulation (EU) 596/2014 as it forms part of UK domestic law by virtue of the European Union (Withdrawal) Act 2018 ("MAR"), and is disclosed in accordance with the Company's obligations under Article 17 of MAR. Upon the publication of this announcement via the Regulatory Information Service, this inside information is now considered to be in the public domain.
Enquiries: |
Trifast plc |
Iain Percival, Chief Executive Officer Kate Ferguson, Chief Financial Officer Christopher Morgan FCG, Company Secretary |
Office: +44 (0) 1825 747630 |
Email: corporate.enquiries@trifast.com |
Shareholders: companysecretariat@trifast.com |
Singer Capital Markets (Joint Broker) |
Sara Hale |
Graham Hertrich |
Dan Ingram |
Tel: +44 (0) 207 496 3000 |
Berenberg (Joint Broker) |
Harry Nicholas |
Ciaran Walsh |
Christopher Whitaker |
Tel +44 (0) 203 207 7800 |
Editors' notes |
About Trifast plc (LSE Main listing: symbol: TRI) In 2023, TR celebrated 50 years of business with a proud heritage of serving customers with engineered fastening supply chain solutions. Specialising in the design, engineering, manufacture, and distribution of high-quality engineered fastenings and Category 'C' components principally for major global assembly industries. As an international business we can provide customer support from across key regions in the UK & Ireland, Asia, Europe, and North America. In addition to our service locations, we operate manufacturing facilities focused on high volume cold forged fasteners and special parts. We have also established Engineering & innovation centres to support R&D and customer collaboration across the world. The Group supplies to customers in c.65 countries across a wide range of industries, including Automotive, Smart Infrastructure and Medical Equipment. As a full-service provider to multinational OEMs and Tier 1 companies spanning several sectors, we deliver comprehensive support to our customers across every requirement, from concept design through to technical engineering consultancy, manufacturing, supply management, and global logistics.
We have defined a clear purpose and vision: To sustainably drive our customers' success by simplifying their fastener supply chain and supporting them in their technical requirements through our world-class engineering and manufacturing capabilities.
For more information, visit: TRIFAST PLC TRI Stock | London Stock Exchange website: www.trifast.com LinkedIn: www.linkedin.com/company/tr-fastenings X: www.x.com/trfastenings Facebook: www.facebook.com/trfastenings
Note Trifast, TR and TR Fastenings are registered trademarks of the Company LEI number: 213800WFIVE6RWK3CR22
|
Trifast plc
Annual results for the year ended 31 March 2026
[Put pdf link here]
Extracts from the letter to the shareholders from the Non-Executive Chair, Serena Lang
FY26 performance
I am delighted to report a robust full-year performance by the Group.
Led by our committed Executive Leadership Team (ELT), Trifast continues to build on the strategy, enabling strength for further success.
Governance
The Board remains focused on ensuring that the applicable Principles of the UK Corporate Governance Code are applied. My introduction to the governance report on pages 46 to 53 sets out how the Board has complied with the applicable Principles of the UK Corporate Governance Code 2024 throughout the financial year ended 31 March 2026.
Our people
The Board would like to thank all Trifast employees for their continued commitment to ensuring we meet our customer requirements and their relentless drive to innovate and adapt to changing customer needs. Our ELT and management teams have demonstrated an outstanding ability to combine market knowledge with customer engagement and innovation to consistently deliver high-quality products and services to the market.
The Group has a clear strategy and a direct line of sight for further value creation opportunities. I look forward to our future with confidence as we continue to build on the significant progress of our strategy and the continued transformation of this Company as part of our Rebuild and Resilience journey.
Dividend
The Board is recommending a final dividend for the year ended 31 March 2026 of 1.30p.
Our continued focus on growth through the transformation process allows the Board to monitor our dividend policy and adjust where it is prudent to do so.
We continue to encourage shareholders to elect for the Dividend Reinvestment Plan, which we launched last year and is proving a success with many shareholders.
Finally, on behalf of the Board, I would like to thank our colleagues, suppliers, customers and investors for their continued support. Your Board has the right balance of skills and expertise to continue to support and challenge management as we progress forward. We can also confirm that this Annual Report, taken as a whole, is fair, balanced and understandable and provides the information necessary to assess the Company's position, performance, business model and strategy.
To read the Chair's letter in full please refer to page 3 of the Annual Report 2026
Trifast plc
Annual results for the year ended 31 March 2026
Extracts from CEO review by Iain Percival
Recover, Rebuild, Resilience
I am delighted to report on a year of further successful execution of our 'Recover, Rebuild, Resilience' strategy and want to start with offering my thanks to the employees of Trifast for the progress and results in what was undoubtedly another challenging year from an external environment and markets perspective.
Last year, I was able to report that we delivered the first step of our strategy, 'Recover,' implementing our new purpose, vision, values and business strategy and achieving the positive change in performance. This year, we have been able to drive on with momentum and deliver the first year of our second phase 'Rebuild', where we are striving to deliver performance for our employees, customers and shareholders in line with our historic best.
Our people
Our goal remains that "we all go home safe every day" and whilst we had ten lost time accidents this year, the severity and impact on our people in terms of physical impact and lost days was reduced by 64%. More positively, our proactive engagement from our teams into raising and recording safety observations more than doubled to 2,355 reported, with all TR locations demonstrating year-on-year progress. Our newly implemented EHS framework and 'Golden Safety Rules' have been received well and further demonstrate the ambition and commitment we collectively have to making Trifast a safer and more responsible place to work.
I have enjoyed getting out to our sites and engaging with the teams personally, and this year, we added to these executive engagements a Board Employee Engagement approach, with Louis Eperjesi spending time in Asia, Laura Whyte spending time in the UK and Europe, and Clive Watson visiting our North American locations in June 2026.
This demonstrates the commitment that both the Board and the ELT have to ensure we are listening and addressing improvements at site level, through the Workforce Engagement Groups, making Trifast a better place to work. We know from the last employee survey that there are still significant areas to improve to achieve this ambition and our work therefore continues in FY27.
I strengthened the Executive Leadership Team again this year with the appointment of Eva Pitts as North American Managing Director in July 2025, and then Randy Guzman as Asia and Middle East Managing Director who joined in November 2025. Both have significant general and commercial management experience in large industrial corporates and are contributing not only in their regional roles but also as broader members of my team.
Performance
Moving on to business performance, FY26 was characterised by a swathe of external market factors: US trade tariffs in April 2025 and changes thereafter impacted demand, as customers on both sides of the Atlantic tried to adapt their supply chains; and the removal of government incentives on EV vehicles in several countries, coupled with the accelerating share gain of Chinese manufactured EVs, created disruption and programme changes in the automotive sector. In addition, general market uncertainty and volatility held industrial PMI and consumer spending down, and of course at the end of our financial year, the Middle East conflict added to the economic and geopolitical uncertainty.
Against this extraordinary backdrop, I am pleased with our focus and execution of our strategic initiatives, which collectively delivered further improvement in EBIT margins of 1.2% reaching 7.9% for FY26, the second year of significant progress, whilst also delivering meaningful progress in cash generation, especially from working capital and inventory actions. Collectively, we have delivered a strong set of financial results and, importantly, have momentum as we move into FY27. Our leverage ratio remains low at 0.75x and we have plenty of headroom on our banking covenants and arrangements.
Organisation effectiveness
We have made significant investments under our Organisation Effectiveness strategic driver, both in people and capability especially in our commercial function with new Commercial Directors in UK&I, Asia & ME and NA regions as well as increasing and strengthening our Sales teams in all regions, and in technology as we roll out Microsoft Dynamics 365 ERP into our core markets under Project Ignite.
Given the nature of our business and criticality of having high quality data, standardised and efficient processes and a platform providing enhanced controls, transparency, consistency and speed of data analysis and faster decision making, this technology investment we are making through Project Ignite sets us up to deliver the next phase of our financial delivery and growth.
We have seen and continue to see benefits across our business from these investments, enabling greater transparency and decision making on commercial margins, operational efficiencies and working capital improvements. The business processes underpinned by our D365 technology, have been strengthened, commercially, operationally and financially and we find ourselves with positive momentum as we seek to deliver a third straight year of financial improvement with a particular focus this year of adding a return to profitable top-line growth.
Responsible Business
We have taken a more strategic view on being a Responsible Business in FY26, and with Louis Eperjesi as Responsible Business Committee Chair, we have defined a clear set of targets, metrics and plans that deliver them with the timeline reset to 2030, to align with the business strategy cycle and end of our 'Resilience' phase. Structuring the approach around 'people, planet, principles' has enabled greater alignment, engagement and integration with the business.
Looking ahead to FY27
As we start FY27, the external market environment is no less challenging and appears to be the new normal. Our focus is on controlling what we can control, and driving positively forward in customer engagement, around our core value propositions of supply chain simplification solutions, engineering expertise and manufacturing excellence, which will ensure that we deliver a year of further progress and positive results. I am confident that we can and will demonstrate to our employees, customers and shareholders that Trifast is well on track to complete the second phase of our 'Recover, Rebuild, Resilience' strategy. I am also looking forward to engaging with our shareholders again at our AGM in September.
To read the CEO review in full please refer to pages 4-5 of the Annual Report 2026
Trifast plc
Annual results for the year ended 31 March 2026
Extracts from the financial review by our CFO, Kate Ferguson
Delivering Disciplined Progress
FY26 marked the first full year of execution within the Rebuild phase of our Recover, Rebuild, Resilience strategy. During the year, we maintained a strong focus on margin management, operational efficiency, disciplined capital allocation and enhanced financial controls, with self-help actions continuing to deliver tangible benefits. While demand conditions remained mixed across certain end markets, improved cash generation and lower leverage strengthened the Group's financial position. These actions have further positioned the business to progress towards the Resilience phase with growing confidence, supporting our mid-term margin and returns ambitions and our commitment to sustainable, responsible investment.
Key financials
Unless stated otherwise, current year comparisons with prior year are calculated at constant exchange rates (CER) and where we refer to 'underlying,' this is defined as being before separately disclosed items. CER calculations have been calculated by translating the FY26 figures by the average FY25 exchange rate.
£m | CER FY26 | CER Change | AER FY26 | AER FY25 | AER Change | |
UK & Ireland | Revenue | 64.2 | -11.1% | 64.3 | 72.2 | -11.0% |
uEBIT1 | 4.5 | 55.2% | 4.5 | 2.9 | 55.2% | |
uEBIT % | 7.0% | 290 bps | 7.0% | 4.1% | 290 bps | |
Europe | Revenue | 72.9 | -7.5% | 75.8 | 78.8 | -3.8% |
uEBIT | 8.1 | 17.4% | 8.6 | 6.9 | 24.6% | |
uEBIT % | 11.1% | 230 bps | 11.3% | 8.8% | 250 bps | |
Asia | Revenue | 46.4 | -9.9% | 46.3 | 51.5 | -10.1% |
uEBIT | 5.1 | -42.0% | 5.0 | 8.8 | -43.2% | |
uEBIT % | 11.0% | -620 bps | 10.9% | 17.2% | -630 bps | |
North America | Revenue | 35.1 | 6.0% | 33.6 | 33.1 | 1.5% |
uEBIT | 3.3 | 10.0% | 3.1 | 3.0 | 3.3% | |
uEBIT % | 9.5% | 40 bps | 9.3% | 9.1% | 20 bps | |
Central Costs | Revenue | - 11.5 | -5.0% | - 11.5 | -12.1 | -5.0% |
uEBIT | -4.7 | -30.9% | -4.7 | -6.8 | -30.9% | |
Group | Revenue | 207.1 | -7.3% | 208.4 | 223.5 | -6.8% |
uEBIT | 16.3 | 9.3% | 16.5 | 14.9 | 10.7% | |
uEBIT % | 7.8% | 110 bps | 7.9% | 6.7% | 120 bps |
1. Underlying Earnings before interest and tax (UEBIT)
Despite lower revenue and a significant increase in separately disclosed transformation costs, the Group delivered a clear improvement in underlying profitability, earnings per share, return on capital employed, gross margin, cash generation and working capital efficiency, while maintaining a resilient balance sheet and continuing dividend payments.
Revenue (CER) reduced to £207.1m (FY25: £223.5m); however, underlying performance improved strongly. Gross margin increased to 30.0% (FY25: 28.3%), representing a 170bps improvement. Underlying EBIT (CER) rose to £16.3m (FY25: £14.9m), with the margin improving to 7.8% (FY25: 6.7%).
This improvement was supported by disciplined cost management across the Group. Cost of sales reduced by £14.2m, distribution expenses by £1.1m and administrative expenses before separately disclosed items by £1.6m. Total payroll costs reduced to £45.8m from £49.0m, alongside a reduction in average headcount to 1,020 from 1,176.
Underlying profit before tax increased to £12.3m (FY25: £10.4m), supported by improved trading performance and lower net financing costs of £4.2m (FY25: £4.5m).
These gains were achieved despite a substantial increase in separately disclosed items of £12.3m (FY25: £5.4m), primarily relating to Project Ignite, restructuring and transformation activity, impairment charges and the Malaysia manufacturing write-off. As a result, statutory profit before tax reduced to £0.1m (FY25: £4.9m).
UK & Ireland
Revenue (CER) was £64.2m, an 11.1% decline from last year (FY25: £72.2m). Automotive customer demand weakened during the year, including disruption arising from the cyber security incident at a key OEM, which had a material short-term impact on volumes but stabilised as the year progressed. Performance across Tier 1 and Tier 2 customers was comparatively more resilient.
While volumes declined across smart infrastructure and medical equipment customers, both segments delivered improvements in gross margin, reflecting favourable mix, pricing discipline and cost recovery actions.
The region's uEBIT increased to £4.5m (FY25: £2.9m), with margin improving to 7.0%, up 290bps. This improvement reflects disciplined margin management, cost control and operating efficiencies, which more than offset lower revenues and temporary customer-specific disruption earlier in the year.
Europe
Revenue (CER) declined to £72.9m, a 7.5% decrease from last year. Trading conditions across the eurozone remained challenging, particularly in automotive, where customer demand was softer across several markets. Revenue in smart infrastructure proved more resilient, helping to partially offset automotive and broader industrial weakness. Other end-markets also experienced lower volumes, reflecting continued uncertainty across European manufacturing sectors.
Despite the lower revenue base, the region delivered an improved profitability outcome. uEBIT increased to £8.1m (FY25: £6.9m), with uEBIT margin improving to 11.1%. This represented margin improvement of 230bps, reflecting disciplined cost control, operational efficiency measures and continued focus on margin management and pricing discipline.
Asia
The Asia region reported lower revenue and profitability in FY26. Revenue (CER) reduced to £46.4m, a 9.9% decrease year on year, while reported revenue reduced to £46.3m at AER. Demand was mixed across automotive and other sectors. Automotive volumes were impacted by increased competition, particularly from electric vehicle manufacturers in China, which intensified pricing pressure and delayed customer ordering patterns.
uEBIT decreased to £5.1m at CER, a 42.0% reduction year on year, with uEBIT margin reducing to 11.0%, down 620bps. The reduction in margin reflects lower operating leverage arising from reduced volumes, together with increased competitive pressure in selected markets. During the year, the region was also impacted by currency volatility, with a weakening of the US Dollar following Liberation Day resulting in unrealised foreign exchange losses, which subsequently reversed later in the year.
Despite the near-term challenges, the region remains focused on disciplined margin management, cost control and selective growth opportunities.
North America
North America delivered a resilient performance in FY26, with CER revenue increasing by 6.0% to £35.1m. Growth was supported by continued demand in smart infrastructure, alongside stable performance in automotive, despite a more competitive market backdrop. The region continued to benefit from prior-year new business wins and a focus on higher-quality revenue across targeted customer segments.
uEBIT increased to £3.3m at CER, up 10.0% year on year, with uEBIT margin improving to 9.5%, up 40bps. Margin progression reflects ongoing cost discipline and operational efficiencies delivered across the region, enabling effective uEBIT drop-through from incremental revenue growth while maintaining a disciplined approach to pricing and mix.
Investment in the region continued during FY26 to strengthen capability and resilience in support of future growth.
Central
Central reported a uEBIT loss of £4.7m (FY25: £6.8m), representing a £2.1m improvement year on year. The reduction in losses reflects continued overhead savings delivered through prior restructuring programmes, together with ongoing cost discipline across central functions.
Central results were also impacted by foreign exchange movements, with a lower net exchange gain compared with the prior year. Overall, Central costs remained well controlled, reflecting a continued focus on maintaining a disciplined Group cost base while ensuring appropriate investment in governance, leadership and strategic initiatives to support execution of the Recover, Rebuild and Resilience strategy.
Implementation costs of cloud computing SaaS arrangements
During the year, we identified an error in the accounting treatment of certain costs incurred in implementing cloud‑based Software as a Service ("SaaS") arrangement, following consideration of the April 2021 IFRIC agenda decision on configuration and customisation costs. These costs, which primarily related to the Group's ERP implementation (Microsoft Dynamics 365) under 'Project Atlas', had previously been capitalised.
In line with IAS 8, the error has been corrected retrospectively. The IFRIC agenda decision clarified that such costs should be expensed unless they give rise to a separately identifiable intangible asset controlled by the Group; as this was not the case, the costs have been recognised in the income statement.
Separately disclosed items
2026 £m | 2025 £m | |
Acquired intangible amortisation | (1.6) | (1.7) |
Restructuring and transformation costs | (2.4) | (2.6) |
Project Ignite | (6.0) | - |
Impairment of non‑current assets | (0.9) | - |
Impairment of customer receivable on administration | - | (1.0) |
Malaysia manufacturing write-off | (1.4) | - |
Recovery of prior year fraud loss | 0.2 | - |
Facilitation payment fraud | (0.2) | (0.4) |
Profit on disposal of a subsidiary | - | 0.2 |
Total | (12.3) | (5.5) |
· Amortisation charges on intangible assets acquired in previous years of £1.6m (FY25: £1.7m) are shown as separately disclosed items, consistent with prior years.
· A Malaysia manufacturing write-off of £1.4m was recognised in FY26 following the Board-approved decision under Project Tiger to exit manufacturing operations.
· Restructuring and transformation costs of £2.4m (FY25: £2.6m) relate to transformation initiatives approved by management following the launch of the Group's strategy at the end of FY24. These costs primarily comprise transformation-related implementation costs, redundancy expenses and other costs directly attributable to the execution of these initiatives.
· Project Ignite costs of £6.0m relate to the implementation of the Group's cloud-based ERP system, Microsoft Dynamics 365. In accordance with the IFRIC agenda decision on configuration and customisation costs in cloud computing SaaS arrangements and IAS 38, these costs have been expensed as incurred.
· Impairment of non-current assets of £0.9m comprised £0.5m relating to TR Fastenings Inc. (Houston), including right-of-use assets and property, plant and equipment, and £0.4m relating to goodwill associated with Precision Technology Supplies.
· Facilitation payment fraud comprises a £0.2m charge in FY26 (FY25: £0.4m charge). Separately, the Group recognised a £0.2m insurance recovery relating to a prior-year fraud loss; this has been presented separately and not netted against the current-year charge.
· There was no profit on disposal of a subsidiary recognised in FY26 (FY25: £0.2m), following the disposal of the Group's Norway operations in the prior year.
· There were no impairments of customer receivables recognised in FY26 (FY25: £1.0m), compared with the prior year charge following the administration of a customer.
Net finance costs
Net finance costs were £4.2m (FY25: £4.5m), reflecting interest expense of £4.3m partially offset by interest income of £0.2m. Interest continues to be incurred at an aggregate rate based on EURIBOR, SONIA or SOFR, plus a margin ranging from 2.10% to 3.60%, depending on the Group's leverage.
IFRS 16 lease-related interest contributed £1.2m to total finance expense in FY26 (FY25: £1.0m).
Profit before tax
Statutory profit before tax was £0.1m (FY25: £4.9m). The reduction reflects the impact of separately disclosed items of £12.3m, including Project Ignite, restructuring and transformation costs, impairment charges and the Malaysia manufacturing write-off, partly offset by improved underlying profitability.
Operating cash flow (AER)
Operating cash flows before working capital movements were £15.9m (FY25: £18.7m), a decrease of £2.8m year on year. The reduction was primarily driven by lower statutory profitability, which reflects the impact of separately disclosed items in the year, including £6.0m of Project Ignite costs associated with the Group's strategic ERP transformation programme. The reduction also reflects an unrealised foreign exchange gain, a lower taxation expense add-back, lower finance cost add-backs, and reduced depreciation and amortisation, partly offset by higher non-cash share-based payment charges and impairment-related adjustments.
Cash generated from operations was £20.2m (FY25: £19.1m), reflecting continued working capital discipline and improved cash collection during the year. This included a £1.8m inflow from trade and other receivables and an £8.1m inflow from inventories, partially offset by a £4.3m outflow from trade and other payables. This strong working capital performance helped fund the Group's strategic investment in Project Ignite while maintaining balance sheet strength.
Banking facilities
The Group maintains a core £70.0m committed Revolving Credit Facility (RCF) utilisable in EUR, GBP or USD with no pre-determined currency limits. Our lending group is comprised of four key banking partners, HSBC, Citi, NatWest and KBC Bank NV. The group executed a plus one application in February 2026 extending the RCF to June 2028, both available extensions have now been utilised. The RCF is drawn to £28.6m (€32.75m) as at 31 March 2026 under leverage and interest cover covenants. In addition to the RCF, the Group benefits from EDG UKEF funding of £50.0m, maturing in 2028 with a three-year availability period, as at 31 March this facility is drawn to £20.6m (€17.1m and $7.5m).
The EDG availability period closes mid FY27, the group believes there is still meaningful unused capacity on the loan and will apply for a new UKEF product under the same terms to complete by June 26.
The Group will begin the refinancing process for the RCF in June 2027, one year prior to the facility's maturity.
Adjusted net debt bridge
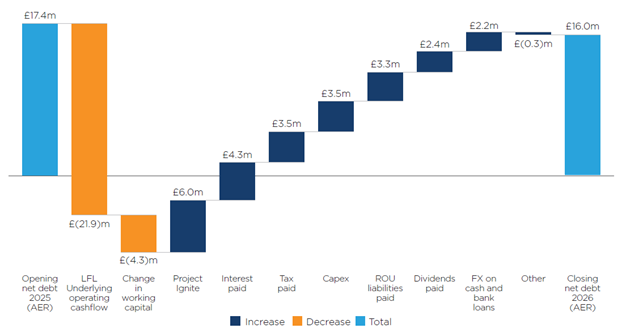
At 31 March 2026, Group adjusted net debt reduced to £16.0m (FY25: £17.4m), reflecting continued cash generation and disciplined financial management. Cash and cash equivalents at the year-end increased to £32.4m (FY25: £24.3m).
A continued focus on working capital efficiency and inventory discipline supported the further reduction in net debt during the year. As a result, the Group's banking covenant position strengthened, with adjusted leverage improving to 0.75x (FY25: 0.97x), providing significant headroom against the covenant limit of 3.0x.
Taxation (AER)
The statutory effective tax rate was 1,823% (FY25: 79%), reflecting the very low level of statutory profit before tax after separately disclosed items, together with the geographic mix of taxable profits and losses and taxes arising in jurisdictions where profits were generated. The underlying effective tax rate reduced to 29.2% (FY25: 44.0%), based on underlying profit before tax of £12.3m (FY25: £10.4m) and an underlying tax charge of £3.6m (FY25: £4.6m).
Underlying diluted earnings per share (AER)
Reflecting the improved underlying performance in the year, underlying profit before tax increased to £12.3m (FY25: £10.4m). This, together with the reduction in the underlying effective tax rate, resulted in underlying diluted earnings per share increasing by 49.9% to 6.46p at AER (FY25: 4.31p).
Return on capital employed (at AER)
The Group's ROCE increased by 40bps to 8.5% (FY25: 8.1%), reflecting improved underlying operating performance and disciplined capital allocation during the year.
As at 31 March 2026, the Group's shareholders' equity was £115.6m (FY25: £115.7m, restated). The movement in equity during the year primarily reflects the loss for the year, dividends paid and foreign exchange translation movements, partly offset by share-based payment credits.
At 31 March 2026, the number of ordinary shares held by the Employee Benefit Trust (EBT) to satisfy future equity award commitments was 1,145,315 (FY25: 1,145,315 shares). Shares in issue at the year-end were 136,188,663 (excluding EBT: 135,043,348).
Outlook
Trading headwinds have persisted into early FY27, reflecting ongoing macroeconomic uncertainty, continued softness in the automotive sector, the impact of US tariffs on steel and aluminium, and foreign exchange volatility, particularly in relation to the US Dollar. In addition, the Group continues to closely monitor the direct and indirect impacts of the ongoing Middle East conflict, including any associated effects on the Group's supply chains.
The Group enters FY27 from a position of improved operational and financial strength, underpinned by the progress delivered through its transformation programme, stronger margins and disciplined cost control.
The Board remains confident in achieving the Group's medium-term EBIT margin target of greater than 10%, supported by the progress delivered through the transformation programme, stronger margins, disciplined cost control and continued focus on margin management.
Trifast plc
Annual results for the year ended 31 March 2026
The notes on pages 97 to 149 form part of these financial statements
Consolidated income statement for the year ended 31 March 2026
Annual report note | 2026 £000 | 2025 £000 | |
Continuing operations |
| ||
Revenue | 3, 34 | 208,374 | 223,466 |
Cost of sales | (145,888) | (160,114) | |
Gross profit | 62,486 | 63,352 | |
Other operating income | 4 | 792 | 766 |
Distribution expenses | (6,763) | (7,869) | |
Administrative expenses before separately disclosed items | (40,020) | (41,572) | |
Acquired intangible amortisation | 2, 13 | (1,550) | (1,731) |
Restructuring and transformation costs | 2 | (2,427) | (2,575) |
Project Ignite | 2 | (5,976) | - |
Impairment of non‑current assets | 2, 13 | (899) | - |
Profit on disposal of a subsidiary | 2 | - | 247 |
Malaysia manufacturing write-off | 2 | (1,390) | - |
Recovery of prior year fraud loss | 2 | 190 | - |
Facilitation payment fraud | 2 | (211) | (384) |
Impairment of customer receivable upon administration | 2 | - | (1,006) |
Total administrative expenses | (52,283) | (47,021) | |
Share of gain of associate accounted for using the equity method | 35 | 6 | 199 |
Operating profit | 5, 6, 7 | 4,238 | 9,427 |
Financial income | 8 | 160 | 275 |
Financial expenses | 8 | (4,341) | (4,774) |
Net financing costs | (4,181) | (4,499) | |
Profit before taxation | 3 | 57 | 4,928 |
Taxation | 9 | (1,039) | (3,888) |
(Loss)/profit for the year |
| ||
attributable to equity shareholders of the Parent Company | (982) | 1,040 | |
(Loss)/profit per share |
| ||
Basic | 25 | (0.73)p | 0.77p |
Diluted | 25 | (0.73)p | 0.77p |
Consolidated statement of comprehensive income for the year ended 31 March 2026
2026 £000 | 2025 £000 | |
(Loss)/profit for the year | (982) | 1,040 |
Other comprehensive income/(expense) for the year: |
| |
Items that may be reclassified subsequently to profit or loss: |
| |
Exchange differences on translation of foreign operations1 | 3,299 | (2,024) |
(Loss)/gain on a hedge of a net investment taken to equity | (1,349) | 675 |
Other comprehensive income/(expense) | 1,950 | (1,349) |
Total comprehensive income/(expense) recognised for the year attributable to the equity shareholders of the Parent Company | 968 | (309) |
1. Net of cumulative foreign exchange loss of £nil (FY25: loss of £0.1m) previously recognised in the foreign currency translation reserve reclassified to profit or loss on disposal of a subsidiary. See note 2 for further details.
Trifast plc
Consolidated statement of changes in equity
Share capital £000 | Share premium £000 | Merger reserve £000 | Own shares held £000 | Translation reserve £000 | Retained earnings £000 | Total equity £000 | |
Balance at 31 March 2025 (restated)1 | 6,806 | 22,537 | 16,328 | (1,833) | 9,147 | 62,736 | 115,721 |
Total comprehensive income for the year: |
|
|
|
|
|
|
|
Loss for the year | - | - | - | - | - | (982) | (982) |
Other comprehensive income for the year | - | - | - | - | 1,950 | - | 1,950 |
Total comprehensive income/(expense) recognised for the year | - | - | - | - | 1,950 | (982) | 968 |
Issue of share capital (note 24) | 4 | 50 | - | - | - | - | 54 |
Share‑based payment transactions (net of tax) (note 22) | - | - | - | - | - | 1,265 | 1,265 |
Other tax-related equity movements | - | - | - | - | - | 27 | 27 |
Dividends (note 24) | - | - | - | - | - | (2,413) | (2,413) |
Total transactions with owners | 4 | 50 | - | - | - | (1,121) | (1,067) |
Balance at 31 March 2026 | 6,810 | 22,587 | 16,328 | (1,833) | 11,097 | 60,633 | 115,622 |
Share capital £000 | Share premium £000 | Merger reserve £000 | Own shares held £000 | Translation reserve £000 | Retained earnings £000 | Total equity £000 | |
Balance at 31 March 2024 (previously stated)1 | 6,806 | 22,537 | 16,328 | (2,194) | 10,496 | 70,205 | 124,178 |
Reversal of previously capitalised SaaS implementation costsa | - | - | - | - | - | (5,359) | (5,359) |
Balance at 31 March 2024 (restated)1 | 6,806 | 22,537 | 16,328 | (2,194) | 10,496 | 64,846 | 118,819 |
Total comprehensive income/(expense) for the year: | |||||||
Profit for the year | - | - | - | - | - | 1,040 | 1,040 |
Other comprehensive expense for the year | - | - | - | - | (1,349) | - | (1,349) |
Total comprehensive (expense)/income recognised for the year | - | - | - | - | (1,349) | 1,040 | (309) |
Issue of share capital (note 24) | - | - | - | - | - | - | - |
Share‑based payment transactions (net of tax) (note 22) | - | - | - | - | - | 446 | 446 |
Movement in own shares held (note 24) | - | - | - | 361 | - | (361) | - |
Dividends (note 24) | - | - | - | - | - | (3,235) | (3,235) |
Total transactions with owners | - | - | - | 361 | - | (3,150) | (2,789) |
Balance at 31 March 2025 (restated)1 | 6,806 | 22,537 | 16,328 | (1,833) | 9,147 | 62,736 | 115,721 |
1. The prior year comparatives have been restated to reflect the correction of an error relating to the accounting for IT implementation costs in accordance with IAS 8 Accounting Policies, Changes in Accounting Estimates and Errors. Refer to note 1 and note 36 of the annual report.
Company statement of changes in equity
Share capital £000 | Share premium £000 | Merger reserve £000 | Own shares held £000 | Retained earnings £000 | Total equity £000 | |
Balance at 31 March 2025 (restated)1 | 6,806 | 22,537 | 16,328 | (1,833) | 8,531 | 52,369 |
Total comprehensive expense for the year: |
|
|
|
|
|
|
Loss for the year | - | - | - | - | (4,509) | (4,509) |
Total comprehensive expense recognised for the year | - | - | - | - | (4,509) | (4,509) |
Issue of share capital (note 24) | 4 | 50 | - | - | - | 54 |
Share‑based payment transactions (net of tax) (note 22) | - | - | - | - | 1,265 | 1,265 |
Dividends (note 24) | - | - | - | - | (2,413) | (2,413) |
Total transactions with owners | 4 | 50 | - | - | (1,148) | (1,094) |
Balance at 31 March 2026 | 6,810 | 22,587 | 16,328 | (1,833) | 2,874 | 46,766 |
Share capital £000 | Share premium £000 | Merger reserve £000 | Own shares held £000 | Retained earnings £000 | Total equity £000 | |
Balance at 31 March 2024 (previously stated)1 | 6,806 | 22,537 | 16,328 | (2,194) | 19,998 | 63,475 |
Reversal of previously capitalised SaaS implementation costsa | - | - | - | - | (5,359) | (5,359) |
Balance at 31 March 2024 (restated)1 | 6,806 | 22,537 | 16,328 | (2,194) | 14,639 | 58,116 |
Total comprehensive expense for the year: | ||||||
Loss for the year | - | - | - | - | (2,940) | (2,940) |
Total comprehensive expense recognised for the year | - | - | - | - | (2,940) | (2,940) |
Issue of share capital (note 24) | - | - | - | - | - | - |
Share‑based payment transactions (net of tax) (note 22) | - | - | - | - | 428 | 428 |
Movement in own shares held (note 24) | - | - | - | 361 | (361) | - |
Dividends (note 24) | - | - | - | - | (3,235) | (3,235) |
Total transactions with owners | - | - | - | 361 | (3,168) | (2,807) |
Balance at 31 March 2025 (restated)1 | 6,806 | 22,537 | 16,328 | (1,833) | 8,531 | 52,369 |
1. The prior year comparatives have been restated to reflect the correction of an error relating to the accounting for IT implementation costs in accordance with IAS 8 Accounting Policies, Changes in Accounting Estimates and Errors. Refer to note 1 and note 36 of the annual report.
Trifast plc
Statement of financial position at 31 March 2026
Group | Company | ||||
Annual report note | 2026 £000 | 2025 £000 (restated)1 | 2026 £000 | 2025 £000 (restated)1 | |
Non‑current assets |
|
| |||
Property, plant and equipment | 10, 11 | 18,902 | 18,593 | 3 | 6 |
Right‑of‑use assets | 12 | 18,159 | 20,283 | 1 | 30 |
Intangible assets | 13, 14 | 27,159 | 28,038 | - | - |
Equity investments | 15, 35 | 259 | 353 | 42,018 | 42,186 |
Non‑current trade and other receivables | 19 | - | - | 63,578 | 56,837 |
Deferred tax assets | 16, 17 | 7,290 | 5,919 | - | - |
Total non‑current assets | 71,769 | 73,186 | 105,600 | 99,059 | |
Current assets |
|
| |||
Inventories | 18 | 64,142 | 70,912 | - | - |
Trade and other receivables | 19 | 54,914 | 55,288 | 2,241 | 2,077 |
Cash and cash equivalents | 26 | 32,425 | 24,258 | 1,792 | 590 |
Total current assets | 151,481 | 150,458 | 4,033 | 2,667 | |
Total assets | 3 | 223,250 | 223,644 | 109,633 | 101,726 |
Current liabilities |
|
| |||
Trade and other payables | 21 | 31,173 | 34,589 | 2,742 | 3,081 |
Right‑of‑use liabilities | 12, 20, 26 | 2,934 | 2,805 | 1 | 102 |
Other interest‑bearing loans and borrowings | 20, 26 | - | - | 11,749 | 4,547 |
Provisions | 23 | - | 1,328 | - | - |
Tax payable | 2,050 | 2,443 | - | - | |
Total current liabilities | 36,157 | 41,165 | 14,492 | 7,730 | |
Non‑current liabilities |
|
| |||
Other interest‑bearing loans and borrowings | 20, 26 | 48,375 | 41,627 | 48,375 | 41,627 |
Right‑of‑use liabilities | 12, 20, 26 | 17,015 | 18,513 | - | - |
Other payables | 21 | 578 | 543 | - | - |
Provisions | 23 | 1,600 | 1,623 | - | - |
Deferred tax liabilities | 16, 17 | 3,903 | 4,452 | - | - |
Total non‑current liabilities | 71,471 | 66,758 | 48,375 | 41,627 | |
Total liabilities | 3 | 107,628 | 107,923 | 62,867 | 49,357 |
Net assets | 115,622 | 115,721 | 46,766 | 52,369 | |
Equity |
|
| |||
Share capital | 6,810 | 6,806 | 6,810 | 6,806 | |
Share premium | 22,587 | 22,537 | 22,587 | 22,537 | |
Merger reserve | 16,328 | 16,328 | 16,328 | 16,328 | |
Own shares held | (1,833) | (1,833) | (1,833) | (1,833) | |
Translation reserves | 11,097 | 9,147 | - | - | |
Retained earnings | 60,633 | 62,736 | 2,874 | 8,531 | |
Total equity | 115,622 | 115,721 | 46,766 | 52,369 | |
1. The prior year comparatives have been restated to reflect the correction of an error relating to the accounting for IT implementation costs in accordance with IAS 8 Accounting Policies, Changes in Accounting Estimates and Errors. Refer to note 1 and note 36 of the annual report.
The loss after tax for the Company is £4.5m (FY25: loss after tax £2.9m).
Trifast plc
Statement of financial position for the year ended 31 March 2026
Group | Company | ||||
Annual report note | 2026 £000 | 2025 £000 | 2026 £000 | 2025 £000 | |
Cash flows from operating activities |
|
| |||
Loss for the year | (982) | 1,040 | (4,509) | (2,938) | |
Adjustments for: |
|
| |||
Depreciation and amortisation | 10, 11, 13, 14 | 4,453 | 5,386 | 3 | 724 |
Right‑of‑use asset depreciation | 12 | 3,660 | 3,487 | 29 | 26 |
Unrealised foreign currency loss/(gain) | 1,422 | 90 | 38 | (9) | |
Financial income | 8 | (160) | (275) | (791) | (1,084) |
Financial expense (excluding right‑of‑use liabilities) | 8 | 3,180 | 3,758 | 3,604 | 4,211 |
Right‑of‑use liabilities' financial expense | 8, 12 | 1,161 | 1,016 | - | 5 |
Share of (loss)/gain of associate accounted for using the equity method | 6 | (199) | - | - | |
Loss on sale of property, plant and equipment, intangibles and investments | (56) | (26) | - | - | |
Dividends received | - | - | (2,584) | (7,082) | |
Equity settled share‑based payment charge | 1,244 | 426 | 827 | 428 | |
Impairment of goodwill and intangible assets | 2, 3, 13 | 370 | - | - | - |
Gain on termination of right‑of‑use liabilities and expense on lease back | (101) | - | (101) | - | |
Recovery of prior year fraud loss | 2 | (190) | - | - | - |
Facilitation payment fraud | 2 | 211 | 384 | - | - |
Investments and loans/debtors due from subsidiaries written off | - | - | 168 | - | |
Gain on sale of disposal of a subsidiary | 2 | - | (247) | - | - |
Impairment of right‑of‑use assets and property, plant and equipment | 2, 10, 11, 12 | 529 | - | - | - |
Non-cash tax appropriations | 143 | - | - | - | |
Taxation expense | 9 | 1,039 | 3,888 | 25 | 66 |
Operating cash inflow/(outflow) before changes in working capital and provisions | 15,929 | 18,728 | (3,291) | (5,653) | |
Change in trade and other receivables1 | 1,816 | (313) | 660 | 1,731 | |
Change in inventories | 8,077 | 1,629 | - | - | |
Change in trade and other payables | (4,264) | 49 | (309) | 801 | |
Change in provisions | (1,326) | (1,030) | - | (609) | |
Cash generated from/(used in) operations | 20,232 | 19,063 | (2,940) | (3,730) | |
Tax paid | (3,495) | (2,168) | - | (3) | |
Net cash generated from/(used in) operating activities | 16,737 | 16,895 | (2,940) | (3,733) | |
Group | Company | ||||
Note | 2026 £000 | 2025 £000 | 2026 £000 | 2025 £000 | |
Cash flows from investing activities | |||||
Proceeds from sale of property, plant and equipment | 52 | 292 | - | - | |
Proceeds from sale of assets classified as held for sale | 10 | - | 632 | - | - |
Interest received | 547 | 283 | 899 | 877 | |
Investment in an associate | (60) | - | - | - | |
Acquisition of property, plant and equipment and intangibles | 10, 11, 13, 14 | (3,483) | (3,422) | - | 12 |
Lending to subsidiary undertakings | - | - | (1,239) | (2,192) | |
Repayment by subsidiary undertakings | - | - | 2,859 | 4,709 | |
Dividends received | 163 | - | 2,584 | 7,082 | |
Net cash generated (used in)/from investing activities | (2,781) | (2,215) | 5,103 | 10,488 | |
Cash flows from financing activities | |||||
Proceeds from the issue of share capital | 24 | 54 | - | 54 | - |
Repayment of external loans | 32 | (2,180) | - | (2,180) | - |
Proceeds from external loans | 32 | 6,915 | 629 | 6,915 | 629 |
Proceeds from loans from subsidiaries | - | - | 3,265 | 1,484 | |
Repayment of loans from subsidiaries | - | - | (3,000) | (2,566) | |
Repayment of right‑of‑use liabilities | 12 | (3,305) | (4,404) | - | (11) |
Dividends paid | 24 | (2,430) | (2,426) | (2,430) | (2,426) |
Interest paid | (4,325) | (4,672) | (3,585) | (4,185) | |
Net cash used in financing activities | (5,271) | (10,873) | (961) | (7,075) | |
Net change in cash and cash equivalents | 8,685 | 3,807 | 1,202 | (320) | |
Cash and cash equivalents at 1 April | 24,258 | 20,884 | 590 | 910 | |
Effect of exchange rate fluctuations on cash held | (518) | (433) | - | - | |
Cash and cash equivalents at 31 March | 32,425 | 24,258 | 1,792 | 590 | |
1. The Company movement in working capital excludes the impact of a loan novation undertaken during the year as part of the Group's strategy to better manage foreign exchange risk. The transaction was non-cash in nature and is disclosed in note 19 of the annual report.
Trifast plc
Annual results for the year ended 31 March 2026
Summary notes to the annual results announcement
1. Underlying profit before tax and separately disclosed items
Annual report note | 2026 £000 | 2025 £000 | |
Underlying profit before tax | 12,320 | 10,377 | |
Separately disclosed items within administrative expenses |
| ||
Acquired intangible amortisation | 13 | (1,550) | (1,731) |
Restructuring and transformation costs | (2,427) | (2,575) | |
Project Ignite | (5,976) | - | |
Impairment of non‑current assets | 13 | (899) | - |
Impairment of customer receivable on administration | - | (1,006) | |
Malaysia manufacturing write-off | (1,390) | - | |
Recovery of prior year fraud loss | 190 | - | |
Facilitation payment fraud | (211) | (384) | |
Profit on disposal of a subsidiary | - | 247 | |
Profit before tax | 57 | 4,928 |
Annual report note | 2026 £000 | 2025 £000 | |
Underlying EBITDA | 31 | 23,064 | 22,018 |
Separately disclosed items within administrative expenses |
| ||
Restructuring and transformation costs | (2,427) | (2,575) | |
Project Ignite | (5,976) | - | |
Impairment of non‑current assets | 13 | (899) | - |
Impairment of customer receivable on administration | - | (1,006) | |
Malaysia manufacturing write-off | (1,390) | - | |
Recovery of prior year fraud loss | 190 | - | |
Facilitation payment fraud | (211) | (384) | |
Profit on disposal of a subsidiary | - | 247 | |
EBITDA | 12,351 | 18,300 | |
Acquired intangible amortisation | 13 | (1,550) | (1,731) |
Depreciation, right‑of‑use assets and non‑acquired amortisation | (6,563) | (7,142) | |
Operating profit | 4,238 | 9,427 |
2. Operating segmental analysis
The Group is comprised of the following main geographical operating segments:
· UK & Ireland
· Europe: includes Sweden, Hungary, Holland, Italy, Germany and Spain
· North America
· Asia: includes Malaysia, China, Singapore, Taiwan, Thailand and India
In presenting information on the basis of geographical operating segments, segment revenue and segment assets are based on the geographical location of our entities across the world and are consolidated into the four distinct geographical regions, which the Executive Leadership Team (the 'ELT') uses to monitor and assess the Group. Interest is reported on a net basis rather than gross as this is how it is presented to the Chief Operating Decision Maker. All material non‑current assets are located in the country the relevant Group entity is incorporated in.
March 2026 | UK & Ireland £000 | Europe £000 | North America £000 | Asia £000 | Common amounts £000 | Total £000 |
Revenue |
|
|
|
|
|
|
Revenue from external customers | 61,580 | 74,196
| 32,685
| 39,913
| - | 208,374
|
Inter‑segment revenue (eliminated on consolidation) | 2,678
| 1,594
| 866
| 6,359
| - | 11,497
|
Total revenue | 64,258
| 75,790
| 33,551
| 46,272
| - | 219,871
|
Underlying operating result | 4,475
| 8,593
| 3,130
| 5,043
| (4,740)
| 16,501
|
Net financing costs | (463)
| (699)
| (671)
| 400
| (2,748)
| (4,181)
|
Underlying segment result | 4,012
| 7,894
| 2,459
| 5,443
| (7,488)
| 12,320
|
Separately disclosed items (see note 2) | (899)
| (3,035)
| (2,461)
| (4,591)
| (1,277)
| (12,263)
|
Profit/(loss) before tax | 3,113
| 4,859
| (2)
| 852
| (8,765)
| 57
|
Specific disclosure items |
|
|
|
|
|
|
Depreciation and amortisation | 2,529
| 3,174
| 805
| 1,497
| 108
| 8,113
|
Assets and liabilities |
|
|
|
|
|
|
Non‑current asset additions | 983 | 1,450 | 223 | 2,969 | 814 | 6,439 |
Non‑current assets1 | 24,810
| 13,827
| 3,120
| 21,824
| 898
| 64,479
|
Segment assets | 67,492
| 67,877
| 25,545
| 56,695
| 5,641
| 223,250
|
Segment liabilities | (21,476) | (19,054) | (3,312) | (10,004) | (53,782) | (107,628) |
1. Non‑current assets exclude financial instruments and deferred tax
March 2025 | UK & Ireland £000 | Europe £000 | North America £000 | Asia £000 | Common amounts £000 | Total £000 |
Revenue |
|
|
|
|
|
|
Revenue from external customers | 69,126 | 77,171 | 32,978 | 44,191 | - | 223,466 |
Inter‑segment revenue (eliminated on consolidation) | 3,036 | 1,659 | 131 | 7,356 | - | 12,182 |
Total revenue | 72,162 | 78,830 | 33,109 | 51,547 | - | 235,648 |
Underlying operating result | 2,927 | 6,926 | 3,008 | 8,846 | (6,831) | 14,876 |
Net financing costs | (65) | (916) | (873) | 462 | (3,107) | (4,499) |
Underlying segment result | 2,862 | 6,010 | 2,135 | 9,308 | (9,938) | 10,377 |
Separately disclosed items (see note 2) | (1,201) | (2,060) | (381) | (432) | (1,375) | (5,449) |
Profit/(loss) before tax | 1,661 | 3,950 | 1,754 | 8,876 | (11,313) | 4,928 |
Specific disclosure items | ||||||
Depreciation and amortisation | (2,357) | (3,287) | (840) | (1,552) | (837) | (8,873) |
Assets and liabilities | ||||||
Non‑current asset additions | 6,046 | 4,695 | 198 | 863 | - | 11,802 |
Non‑current assets1 | 26,768 | 16,317 | 4,297 | 19,733 | 5,510 | 72,626 |
Segment assets | 71,186 | 69,946 | 24,322 | 56,468 | 7,081 | 229,003 |
Segment liabilities | (22,454) | (20,041) | (4,282) | (10,497) | (50,586) | (107,860) |
1. Non‑current assets exclude financial instruments and deferred tax
There were no material differences in North America between the external revenue based on location of the entities and the location of the customers. Of the UK & Ireland external revenue, £8.6m (FY25: £6.2m) was sold into the European market. Of the Asian external revenue, £3.8m (FY25: £4.4m) was sold into the North American market and £3.5m (FY25: £3.2m) was sold into the European market.
Within UK & Ireland, TR Fastenings Ltd has revenue of £44.6m (FY25: £53.1m) and non-current assets of £3.1m (FY25: £2.9m).
Within Europe, TR Italy has revenue of £23.6m (FY25: £27.0m) and non‑current assets of £7.7m (FY25: £8.0m).
Within Asia, TR Formac Singapore has revenue of £17.0m (FY25: £19.9m) and non‑current assets of £4.4m (FY25: £4.2m).
Revenue is derived solely from the manufacture and logistical supply of industrial fasteners and Category 'C' components.
3. Going concern
Current trading and forecasts show that the Group will continue to generate positive EBITDA and generate cash. The banking facilities and covenants (leverage and interest cover) that are in place provide appropriate headroom against forecasts based on the current outlook. There are some headwinds in the global economic environment including the impact of the tariffs and the elevated interest rate environment; however, should there be adverse factors beyond expectation, the Directors are confident, given the low levels of leverage within the business and the expectation that this will reduce further, that these would be mitigated.
As such, the Directors do not consider there to be material uncertainties relating to events or conditions that may be relevant to the next 12 months from signing of the annual financial statements, which cast doubt on the going concern status. This is also the case after performing sensitivity analysis, reverse stress testing scenarios to break point for the covenants and understanding what this would equate to either increasing net debt or reducing EBITDA, the key inputs of which have been disclosed on pages 44 and 45 of the annual report. Thus, based on the stress testing performed (excluding the impact of potential mitigating actions), a breach of the Group's covenants is considered unlikely. The Group has substantial headroom against its banking covenants and is not considered sensitive to reasonably foreseeable changes in trading performance or financing costs. Based on this analysis, the Directors have a reasonable expectation that the Group has adequate resources to continue in operational existence for the foreseeable future and therefore continue to adopt the going concern basis of accounting in preparing the annual financial statements.
4. Annual report 2026 and Basis of preparation
The Annual report and financial statements for the year ended 31 March 2026 were approved by the Board of Directors on 1 July 2026.
In addition to the link on the front of this announcement to a pdf of the Annual Report 2026, a copy of this report, together with the Notice of Meeting will in due course be available to view and download from the Company website at www.trifast.com. The documents will also be uploaded to the National Storage Mechanism at:
https://data.fca.org.uk/#/nsm/nationalstoragemechanism.
The financial information set out in this release does not constitute the Group's statutory Report and Accounts for the years ended 31 March 2026 or 2025 within the meaning of the section 434 of the Companies Act 2006. However, it is derived from the Annual report 2026 http://www.rns-pdf.londonstockexchange.com/rns/6987K_1-2026-7-1.pdf
The statutory accounts for the year ended 31 March 2025 have been delivered to the Registrar of Companies and those for 2026 will be delivered in due course. The external auditor has reported on the 2026 Report and Accounts; the report was (i) unqualified, (ii) did not include references to any matters to which the external auditor drew attention by way of emphasis without qualifying the reports and (iii) did not contain statements under section 498(2) or (3) of the Companies Act 2006.
The Independent auditor's report to the members of Trifast plc can be read on pages 84-89 of the Annual report 2026.
5. Annual General Meeting (AGM)
The Annual General Meeting will be held at 12.00noon on 8 September 2026 at OSIT, 46 New Broad Street, London EC2M 1JH.
The Notice of Meeting, which includes special business to be transacted at the AGM together with an explanation of the resolutions to be considered at the meeting, is made available on the Company's website and communicated directly to shareholders.