2 Jul 2026 17:01
MINERAL AND FINANCIAL INVESTMENTS LIMITED
Unaudited Quarterly Net Asset Value Was £17.0M on 31-03-2026, an Increase of 28.3% Year/Year
HIGHLIGHTS
· NAV (31/3/2026) was up to £16,962,000 or up 28.3% yr/yr from £13,219,000
· NAVPS3 (FD) was 40.5p on 31 March 2026, from 33.5p an increase of 21.0% yr/yr
· Unaudited EPS3 (FD) was up 68% yr/yr to 7.4p for 9 Mo. to 31-03-2026, (vs. 4.4p)
· M&F's Total Investable Capital[1] rose 28.4% yr/yr to £17,438,000
· Working capital2 is strong at £17,197,000, with no long-term debt
George Town, Cayman Islands - 2 July 2026 - Mineral and Financial Investments Limited (LSE-AIM: MAFL) ("M&F", "MAFL" or the "Company") is pleased to provide an unaudited quarterly update of its financial performance and its Net Asset Value for the quarter ending 31 March 2026. At the end of the third quarter, the NAV was £16,962,000, an increase of 28.3% from £13,219,000 achieved in the same period one year ago (see table 1). The Net Asset Value Per Share (FD) was 40.5p at the end of the Q3-2026 period, up 21.0% year on year. Unaudited gross profit for the 9 months ended 31 March 2026 was £3,698,000 (+68% yr/yr) and the unaudited net profit was £3,152,000 (+78% yr/yr). Earnings per share of 7.4p fully diluted and 8.3p basic. M&F's Total Investable Capital1 was £17,438,000, up 28.4% from a year ago. The Company's working capital at the period end was £17,197,000[2]. The following is a summary of the NAV, updated to include this unaudited NAV calculation:
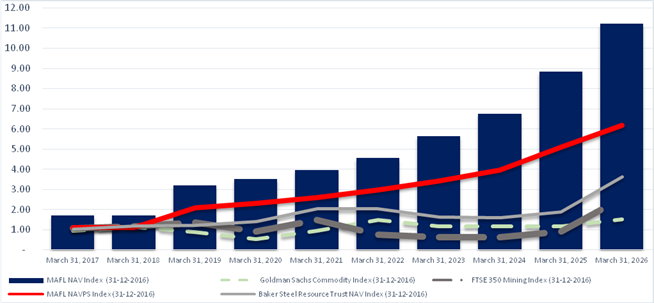
SUMMARY OF HISTORICAL PERFORMANCE
(Table 1)
31 March 2021 | 31 March 2022 | 31 March 2023 | 31 March 2024 | 31 March 2025 | 31 March 2026 | '26/'25 % Ch. | '26/ '21 CAGR | |
Net Asset Value (NAV, Mlns.) | £6.012 | £6.940 | £8.394 | £10.114 | £13.219 | £16.962 | 28.3% | 23.1% |
NAVPS[3] (FD) | 17.1p | 19.6p | 22.5p | 26.0p | 33.5p | 40.5p | 21.0% | 18.9% |
FTSE 350 Mining Index | 21,911 | 10,926 | 10,161 | 9,415 | 13,482 | 37,826 | 180.6% | 11.5% |
GS Commodity Index | 467.4 | 724.2 | 574.0 | 582.5 | 568.1 | 768.4 | 31.2% | 9.8% |
Baker Steel Natural Res. Trust | 97.4p | 97.5p | 76.8p | 76.6p | 89.4p | 174.0p | 93.8% | 12.3% |
M&F's year-on-year NAVPS (FD) growth of 21.0%. Our Fully Diluted per share growth was lower to our overall growth due to the granting of some equity related employee incentive grants. Our earnings have increased nearly 475% since 31 March 2020. The net result being an average 5-year Compound Annual Growth Rate ("CAGR") of 18.9% of our NAVPS (FD) in this period.
The US White House announced the first of its attacks on Iran on April 14, 2026. The performance of commodities began feeling the chill of the planned "conflict" prior to the attack in the first quarter of calendar 2026 as the US naval fleet amassed in the Middle-East. West Texas Intermediate ("WTI") increased 59.5% to US$91.57/bbl during our Q3 period. This impacted virtually all metal commodity prices. Copper, believed by some to be "the" economic barometer, was down 2.7% in the quarter to US$12,181/t. Gold peaked at US$5,634/oz on January 28, 2026, and ebbed and flowed downward ever since and currently sits at US$4,025/oz, a 29% decline. Silver has performed similarly peaking at US$119.75/oz on January 9, 2026, and currently is at US$58.09/oz, down 51%. It is noteworthy that the US dollar, as measured by the DXY index, bottomed on January 27, 2026 @ 95.75, and is currently at 101.2. The strength in the US is due to many coincident issues in late June 2026, a belief that the economy is performing well, that the cessation of most of the military attacks by the USA on Iran will normalize oil prices - market belief is that this will lead to improved US economic performance. A new Federal Reserve Board chair (Kevin Warsh) is expected to be supportive of the US President's desire to see interest rates at lower levels. Nevertheless, we maintain our belief that the US economy is continuing to experience modest growth, and that this growth is not broadly based. Moreover, inflation continues to plague consumer income growth. We believe that US rate cuts will be very difficult to justify until inflation is clearly and sustainably subdued and economic growth is aknowledged as being below trend. That said, it is not improbable that there would be a small and mostly cosmetic rate cut in the autumn of 2026 to appease political pressures.
M&FI NET ASSET VALUE VS. COMPARABLES - INDEXED PERFORMANCE
(Chart 1)
PHYSICAL METAL COMMODITY INVESTMENTS IN Q3/2026
(Table 2)
Commodity Category | Value | As % Of Investable Capital |
Cash | £193,649 | 1.1% |
Physical gold ETF's | £272,906 | 1.5% |
Deferred Gold Delivery Contracts[4] | £3,180,795 | 18.2% |
Physical Silver ETF | £554,493 | 3.2% |
Physical Rhodium ETF | £420,168 | 2.4% |
Physical Copper ETF | £78,290 | 0.4% |
Sub-Total | £4,700,301 | 26.9% |
We found the Q3-2026 period to be very challenging. The precious metal correction we expected in Q2-2026 began in the Q3-2026. After the very rapid rise in precious metal prices in 2025, notably gold and silver, and the even more rapid growth in bullish forecasts by global banks for gold, a correction should not have been a surprise. Equities had rallied leading into our Q3-2026 period, surprisingly in our opinion. The rally was in the face of what we believe to be a very fraught global geo-political and economic setting. In response, we repositioned our Tactical Portfolio equity investments towards copper companies (i.e. AIC Mines, Atico Mining, Aeris Resources, Capstone Copper, ERO Copper, Hudbay Minerals, McEwen Mining, Rio Tinto) which have performed better than precious metal equities. Nevertheless, we have retained some core investments in the precious metal segment, companies that we believe are some of the highest quality producers in the sector: Agnico Eagle (which is now the #2 gold producer in the world), Newmont Corporation (#1 gold producer in the World) , Orla Mining (subject to a take-over in Q4-2026 by Equinox Gold). We opportunistically have added some smaller investments, as they had corrected and represented excellent value, these include - Caledonia Mining, West Red Lake Gold Mines and Vizsla Silver. However, our continued apprehension about equity valuations had led us to increasing our exposure to physical commodities. Cash and physical commodities now represent £4.7 million or 26.9% of our Total Investable Capital1 .
M&F INVESTMENTS - PORTFOLIO COMPOSITION
(Table 3)
INVESTMENT COMMODITY CLASSES | Q3-2026 (£) | Q3-2025 (£) | Change (%) |
Cash | 194,000 | 326,000 | -40.6% |
Precious Metals & Gems | 9,943,000 | 8,719,000 | 14.0% |
Base Metals | 5,600,000 | 3,504,000 | 59.8% |
Food, Energy & Tech | 903,000 | 1,035,000 | -12.7% |
Royalties | 798,000 | - | |
Total Investable Capital | 17,438,000 | 13,584,000 | 28.4% |
Our cash holdings were £194,000 as we increased our holdings in copper producers and physical metals. Additionally, although we are closer than we have been to monetizing some of our strategic investments, we however are still a few months away from realizing some long-awaited gains. As mentioned in previous shareholder reports, several of our strategic investments are generating revenues and cash flow thus do not require to access external capital via an equity raise. The result is that £8,809,000, or 50.5% of our Total Investable Capital1 has not changed in value over the past year. Or, put differently - most of our NAV growth is from 49.5% of our investments. We expect that over the next 12 months several of our strategic investments should be revalued through a monetization event or equity raise events. We continue to believe that the commodity cycle remains in the ascent, we are experiencing a correction and that we shall begin experiencing improved metal commodity pricing in the second half of calendar 2026.
FOR MORE INFORMATION:
Jacques Vaillancourt, Mineral & Financial Investments Ltd. +44 780 226 8247
Katy Mitchell, Zeus Capital +44 207 220 1666
Jon Belliss, ALBR Securities Limited +44 207 382 8300
The information contained within this announcement is deemed by the Company to constitute inside information as stipulated under the Market Abuse Regulations (EU) No. 596/2014 (MAR) as in force in the United Kingdom pursuant to the European Union (Withdrawal) Act 2018. Upon the publication of this announcement via Regulatory Information Service (RIS), this inside information is now considered to be in the public domain.
[1] Investable Capital: Investment Portfolio + Cash and equivalents (Q3-2026 £17,493.178 + £193,649 = £17,438,438)
[2] Current Assets of £17,485,091 less Current Liabilities of £288,124 = Working Capital of £17,196,967
[3] The NAV calculation is subject to audit and is made on the basis of 38,855,871 shares O/S (basic) and 42,355,871 (FD) in issue.
[4] Deferred Gold Delivery Contracts were purchased from Golden Sun Resources @US$1,750/oz.- 6 Months after purchase the contracts lock-in at the spot price and thereafter appreciate at 20% per annum (compounded Quarterly). The contracts allow for either physical delivery of metal, or financial settlement or at M&F's option is entitled to convert in GSR shares at US$1.75 p/s based on the then value of the Contracts .