
ETHUSD: Bullish Engulfing Pattern Above $2,800
Ethereum entered a consolidation channel last week, after which it started to decline touching a low of $2,883 on April 18th in the US trading session.
Ethereum touched an intraday low of $3,066 in the Asian trading session, and an intraday high of $3,108 in the European trading session today.
We can clearly see a bullish engulfing pattern above the $2,800 handle which is a bullish pattern and signifies the end of a bearish phase and the start of a bullish phase in the markets.
ETH is now trading just above its pivot level of 3,092 and moving in a mildly bullish channel. The price of ETHUSD is now testing its classic resistance level of 3,111 and Fibonacci resistance level of 3,121, after which the path towards 3,200 will get cleared.
The relative strength index is at 53 indicating a STRONG demand for Ethereum and the continuation of the bullish trend.
Both the StochRSI and Williams percent range are indicating an overbought level which means that the price is due to decline in the short term.
All of the technical indicators are giving a STRONG BUY market signal. All of the moving averages are giving a STRONG BUY signal, and we are now looking at the levels of $3,300 to $3,400 in the short-term range.
ETH is now trading above both the 100 hourly and exponential moving averages.
- A bullish reversal seen in Eth above the $2,800 mark
- The short-term range appears to be mildly BULLISH
- The daily RSI is below 50 at 49 indicating a NEUTRAL market
- The average true range is indicating LESS market volatility
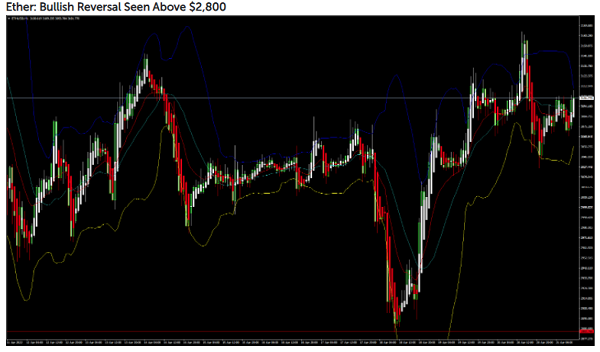
ETHUSD is now moving in a mildly bullish channel with the price trading above the $3,100 handle in the European trading session today.
Ethereum is slowly preparing for its next move against the US dollar. We can see the formation of a bullish harami pattern above the $3,000 handle, and further validates the bullish momentum present in the markets.
ETHUSD is now facing its immediate resistance levels of $3,146 and $3,216, after which we will see a linear progression towards the level of $3,300.
The key support levels to watch are $2,898 and $3,022, and the prices of ETHUSD need to remain above these levels for the continuation of the bullish trend.
ETH has gained 0.07% with a price change of $2.31 in the past 24hrs, and has a trading volume of 16.372 billion USD.
We have seen an increase of 19.21% in the total trading volume in the last 24 hrs. which appears to be normal.
The Week Ahead
This week, the price of Ethereum continues to remain above the 200-day SMA and is now poised towards the formation of a rally into the markets.
As ETH 2.0 is nearing, the projected outlook for Ethereum is close to $5,000 after the successful implementation of the upgrade.
If the price of ETHUSD remains above $3,000, we may see a linear progression towards $3,300 and $3,400 this week.
The immediate short-term outlook for Ether has turned mildly BULLISH; the medium-term outlook has turned neutral; and the long-term outlook for Ether is NEUTRAL in present market conditions.
This week, Ether is expected to move in a range between $3,100 and $3,300, and next week, Ether is expected to enter into a consolidation phase above $3,300.
Technical Indicators:
Stoch (9,6): at 57.06 indicating a BUY
The moving averages convergence divergence (12,26): at 2.19 indicating a BUY
The ultimate oscillator: at 54.11 indicating a BUY
Bull/Bear power (13-day): at 20.56 indicating a BUY
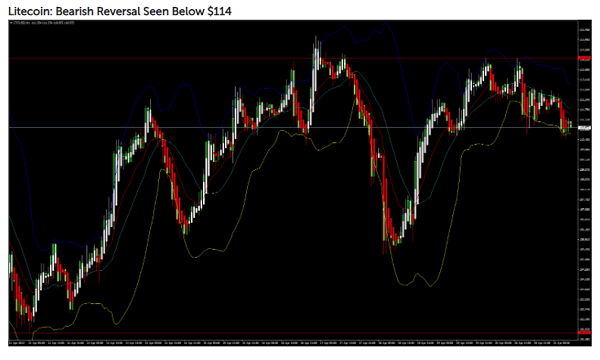
LTCUSD: Double Top Pattern Below $114
Litecoin was unable to sustain its bullish momentum last week, and after entering a consolidation channel this week started to decline touching a low of 110.67 on April 20th.
Now the price of Litecoin has stabilized and entered a mildly bearish channel below the $112 handle.
The bearish momentum continues today pushing the price of LTCUSD down in the European trading session today.
LTUCSD touched an intraday low of 110.47 after which we can see a move towards the consolidation phase.
A double top pattern is observed below $114, which is a bearish pattern and signifies the end of a bullish phase and the start of a bearish phase.
Litecoin is now trading below its 100 hourly simple moving average and exponential moving average. The price of LTCUSD is just above its pivot level of 111.33.
The relative strength index is at 42 indicating a WEAK demand for Litecoin, and the continuation of the bearish momentum in the markets.
The price of Litecoin remains below most of the moving averages, which are now giving a STRONG SELL signal at current market level of 1110.00.
The average directional change is indicating a NEUTRAL level, which means that the prices are expected to remain in the consolidation phase.
The short-term outlook for Litecoin has turned mildly BEARISH.
- All of the technical indicators are giving a STRONG SELL signal
- A bearish reversal seen in Litecoin below $114
- The average directional change is indicating a NEUTRAL level
- The average true range is indicating LESSER market volatility
The price of Litecoin has corrected downwards after touching a high of 102, and a move towards the consolidation phase is observed. If this bearish scenario holds, then we may see the price of Litecoin will touch the level of $105 this week.
We can see a bullish reversal scenario at the level of 110.67 as indicated by the MA200 crossover pattern.
The price of LTCUSD is now facing its classic support level of 109.76 and Fibonacci support level of 110.68 after which the path towards $105 will get cleared.
The daily RSI is printing at 46 which also indicates a neutral demand for Litecoin in the medium term.
LTC has lost 1.37% with a price change of 1.54$ in the past 24hrs and has a trading volume of 0.656 billion USD.
Litecoin trading volume has increased by 1.23% as compared to yesterday which appears to be normal.
The Week Ahead
This week, we are looking at the support level of $100 and the shift towards the consolidation above the $105 handle. If the price remains above these levels, we may see some bullish moves next week.
The short-term outlook for Litecoin has turned mildly BEARISH; the medium-term outlook is NEUTRAL; and the long-term outlook is NEUTRAL at present market conditions.
This week, we are looking at levels of $105 to $115, and next week, Litecoin is expected to consolidate at levels above $110.
Technical Indicators:
The relative strength index (14-day): at 40.88 indicating a SELL
The moving averages convergence divergence (12,26): at -0.357 indicating a SELL
The rate of price change: at -0.804 indicating a SELL
Bull/Bear power (13-day): at -0.916 indicating a SELL